base module
Base class for modeling portfolio and measuring its performance.
Provides the class Portfolio for modeling portfolio performance and calculating various risk and performance metrics. It uses Numba-compiled functions from vectorbt.portfolio.nb for most computations and record classes based on Records for evaluating events such as orders, logs, trades, positions, and drawdowns.
The job of the Portfolio class is to create a series of positions allocated against a cash component, produce an equity curve, incorporate basic transaction costs and produce a set of statistics about its performance. In particular, it outputs position/profit metrics and drawdown information.
Run for the examples below:
>>> import numpy as np
>>> import pandas as pd
>>> from datetime import datetime
>>> import talib
>>> from numba import njit

>>> import vectorbt as vbt
>>> from vectorbt.utils.colors import adjust_opacity
>>> from vectorbt.utils.enum_ import map_enum_fields
>>> from vectorbt.base.reshape_fns import broadcast, flex_select_auto_nb, to_2d_array
>>> from vectorbt.portfolio.enums import SizeType, Direction, NoOrder, OrderStatus, OrderSide
>>> from vectorbt.portfolio import nb
Workflow
Portfolio class does quite a few things to simulate your strategy.
Preparation phase (in the particular class method):
- Receives a set of inputs, such as signal arrays and other parameters
- Resolves parameter defaults by searching for them in the global settings
- Brings input arrays to a single shape
- Does some basic validation of inputs and converts Pandas objects to NumPy arrays
- Passes everything to a Numba-compiled simulation function
Simulation phase (in the particular simulation function using Numba):
- The simulation function traverses the broadcasted shape element by element, row by row (time dimension), column by column (asset dimension)
- For each asset and timestamp (= element):
- Gets all available information related to this element and executes the logic
- Generates an order or skips the element altogether
- If an order has been issued, processes the order and fills/ignores/rejects it
- If the order has been filled, registers the result by appending it to the order records
- Updates the current state such as the cash and asset balances
Construction phase (in the particular class method):
- Receives the returned order records and initializes a new Portfolio object
Analysis phase (in the Portfolio object)
- Offers a broad range of risk & performance metrics based on order records
Simulation modes
There are three main simulation modes.
From orders
Portfolio.from_orders() is the most straightforward and the fastest out of all simulation modes.
An order is a simple instruction that contains size, price, fees, and other information (see Order for details about what information a typical order requires). Instead of creating a Order tuple for each asset and timestamp (which may waste a lot of memory) and appending it to a (potentially huge) list for processing, Portfolio.from_orders() takes each of those information pieces as an array, broadcasts them against each other, and creates a Order tuple out of each element for us.
Thanks to broadcasting, we can pass any of the information as a 2-dim array, as a 1-dim array per column or row, and as a constant. And we don't even need to provide every piece of information - vectorbt fills the missing data with default constants, without wasting memory.
Here's an example:
>>> size = pd.Series([1, -1, 1, -1])  # per row
>>> price = pd.DataFrame({'a': [1, 2, 3, 4], 'b': [4, 3, 2, 1]})  # per element
>>> direction = ['longonly', 'shortonly']  # per column
>>> fees = 0.01  # per frame

>>> pf = vbt.Portfolio.from_orders(price, size, direction=direction, fees=fees)
>>> pf.orders.records_readable
   Order Id Column  Timestamp  Size  Price  Fees  Side
0         0      a          0   1.0    1.0  0.01   Buy
1         1      a          1   1.0    2.0  0.02  Sell
2         2      a          2   1.0    3.0  0.03   Buy
3         3      a          3   1.0    4.0  0.04  Sell
4         4      b          0   1.0    4.0  0.04  Sell
5         5      b          1   1.0    3.0  0.03   Buy
6         6      b          2   1.0    2.0  0.02  Sell
7         7      b          3   1.0    1.0  0.01   Buy
This method is particularly useful in situations where you don't need any further logic apart from filling orders at predefined timestamps. If you want to issue orders depending upon the previous performance, the current state, or other custom conditions, head over to Portfolio.from_signals() or Portfolio.from_order_func().
From signals
Portfolio.from_signals() is centered around signals. It adds an abstraction layer on top of Portfolio.from_orders() to automate some signaling processes. For example, by default, it won't let us execute another entry signal if we are already in the position. It also implements stop loss and take profit orders for exiting positions. Nevertheless, this method behaves similarly to Portfolio.from_orders() and accepts most of its arguments; in fact, by setting accumulate=True, it behaves quite similarly to Portfolio.from_orders().
Let's replicate the example above using signals:
>>> entries = pd.Series([True, False, True, False])
>>> exits = pd.Series([False, True, False, True])

>>> pf = vbt.Portfolio.from_signals(price, entries, exits, size=1, direction=direction, fees=fees)
>>> pf.orders.records_readable
   Order Id Column  Timestamp  Size  Price  Fees  Side
0         0      a          0   1.0    1.0  0.01   Buy
1         1      a          1   1.0    2.0  0.02  Sell
2         2      a          2   1.0    3.0  0.03   Buy
3         3      a          3   1.0    4.0  0.04  Sell
4         4      b          0   1.0    4.0  0.04  Sell
5         5      b          1   1.0    3.0  0.03   Buy
6         6      b          2   1.0    2.0  0.02  Sell
7         7      b          3   1.0    1.0  0.01   Buy
In a nutshell: this method automates some procedures that otherwise would be only possible by using Portfolio.from_order_func() while following the same broadcasting principles as Portfolio.from_orders() - the best of both worlds, given you can express your strategy as a sequence of signals. But as soon as your strategy requires any signal to depend upon more complex conditions or to generate multiple orders at once, it's best to run your custom signaling logic using Portfolio.from_order_func().
From order function
Portfolio.from_order_func() is the most powerful form of simulation. Instead of pulling information from predefined arrays, it lets us define an arbitrary logic through callbacks. There are multiple kinds of callbacks, each called at some point while the simulation function traverses the shape. For example, apart from the main callback that returns an order (order_func_nb), there is a callback that does preprocessing on the entire group of columns at once. For more details on the general procedure and the callback zoo, see simulate_nb().
Let's replicate our example using an order function:
>>> @njit
>>> def order_func_nb(c, size, direction, fees):
...     return nb.order_nb(
...         price=c.close[c.i, c.col],
...         size=size[c.i],
...         direction=direction[c.col],
...         fees=fees
... )

>>> direction_num = map_enum_fields(direction, Direction)
>>> pf = vbt.Portfolio.from_order_func(
...     price,
...     order_func_nb,
...     np.asarray(size), np.asarray(direction_num), fees
... )
>>> pf.orders.records_readable
   Order Id Column  Timestamp  Size  Price  Fees  Side
0         0      a          0   1.0    1.0  0.01   Buy
1         1      a          1   1.0    2.0  0.02  Sell
2         2      a          2   1.0    3.0  0.03   Buy
3         3      a          3   1.0    4.0  0.04  Sell
4         4      b          0   1.0    4.0  0.04  Sell
5         5      b          1   1.0    3.0  0.03   Buy
6         6      b          2   1.0    2.0  0.02  Sell
7         7      b          3   1.0    1.0  0.01   Buy
There is an even more flexible version available - flex_simulate_nb() (activated by passing flexible=True to Portfolio.from_order_func()) - that allows creating multiple orders per symbol and bar.
This method has many advantages:
- Realistic simulation as it follows the event-driven approach - less risk of exposure to the look-ahead bias
- Provides a lot of useful information during the runtime, such as the current position's PnL
- Enables putting all logic including custom indicators into a single place, and running it as the data comes in, in a memory-friendly manner
But there are drawbacks too:
- Doesn't broadcast arrays - needs to be done by the user prior to the execution
- Requires at least a basic knowledge of NumPy and Numba
- Requires at least an intermediate knowledge of both to optimize for efficiency
Example
To showcase the features of Portfolio, run the following example: it checks candlestick data of 6 major cryptocurrencies in 2020 against every single pattern found in TA-Lib, and translates them into orders.
>>> # Fetch price history
>>> symbols = ['BTC-USD', 'ETH-USD', 'XRP-USD', 'BNB-USD', 'BCH-USD', 'LTC-USD']
>>> start = '2020-01-01 UTC'  # crypto is UTC
>>> end = '2020-09-01 UTC'
>>> # OHLCV by column
>>> ohlcv = vbt.YFData.download(symbols, start=start, end=end).concat()
>>> ohlcv['Open']

symbol                          BTC-USD     ETH-USD   XRP-USD    BNB-USD  \
Date
2020-01-01 00:00:00+00:00   7194.892090  129.630661  0.192912  13.730962
2020-01-02 00:00:00+00:00   7202.551270  130.820038  0.192708  13.698126
2020-01-03 00:00:00+00:00   6984.428711  127.411263  0.187948  13.035329
...                                 ...         ...       ...        ...
2020-08-30 00:00:00+00:00  11508.713867  399.616699  0.274568  23.009060
2020-08-31 00:00:00+00:00  11713.306641  428.509003  0.283065  23.647858
2020-09-01 00:00:00+00:00  11679.316406  434.874451  0.281612  23.185047

symbol                        BCH-USD    LTC-USD
Date
2020-01-01 00:00:00+00:00  204.671295  41.326534
2020-01-02 00:00:00+00:00  204.354538  42.018085
2020-01-03 00:00:00+00:00  196.007690  39.863129
...                               ...        ...
2020-08-30 00:00:00+00:00  268.842865  57.207737
2020-08-31 00:00:00+00:00  279.280426  62.844059
2020-09-01 00:00:00+00:00  274.480865  61.105076

[244 rows x 6 columns]

>>> # Run every single pattern recognition indicator and combine the results
>>> result = pd.DataFrame.vbt.empty_like(ohlcv['Open'], fill_value=0.)
>>> for pattern in talib.get_function_groups()['Pattern Recognition']:
...     PRecognizer = vbt.IndicatorFactory.from_talib(pattern)
...     pr = PRecognizer.run(ohlcv['Open'], ohlcv['High'], ohlcv['Low'], ohlcv['Close'])
...     result = result + pr.integer

>>> # Don't look into the future
>>> result = result.vbt.fshift(1)

>>> # Treat each number as order value in USD
>>> size = result / ohlcv['Open']

>>> # Simulate portfolio
>>> pf = vbt.Portfolio.from_orders(
...     ohlcv['Close'], size, price=ohlcv['Open'],
...     init_cash='autoalign', fees=0.001, slippage=0.001)

>>> # Visualize portfolio value
>>> pf.value().vbt.plot()

Broadcasting
Portfolio is very flexible towards inputs:
- Accepts both Series and DataFrames as inputs
- Broadcasts inputs to the same shape using vectorbt's own broadcasting rules
- Many inputs (such as
fees) can be passed as a single value, value per column/row, or as a matrix - Implements flexible indexing wherever possible to save memory
Flexible indexing
Instead of expensive broadcasting, most methods keep the original shape and do indexing in a smart way. A nice feature of this is that it has almost no memory footprint and can broadcast in any direction indefinitely.
For example, let's broadcast three inputs and select the last element using both approaches:
>>> # Classic way
>>> a = np.array([1, 2, 3])
>>> b = np.array([[4], [5], [6]])
>>> c = np.array(10)
>>> a_, b_, c_ = broadcast(a, b, c)

>>> a_
array([[1, 2, 3],
       [1, 2, 3],
       [1, 2, 3]])
>>> a_[2, 2]
3

>>> b_
array([[4, 4, 4],
       [5, 5, 5],
       [6, 6, 6]])
>>> b_[2, 2]
6

>>> c_
array([[10, 10, 10],
       [10, 10, 10],
       [10, 10, 10]])
>>> c_[2, 2]
10

>>> # Flexible indexing being done during simulation
>>> flex_select_auto_nb(a, 2, 2)
3
>>> flex_select_auto_nb(b, 2, 2)
6
>>> flex_select_auto_nb(c, 2, 2)
10
Defaults
If you look at the arguments of each class method, you will notice that most of them default to None. None has a special meaning in vectorbt: it's a command to pull the default value from the global settings config - settings. The branch for the Portfolio can be found under the key 'portfolio'. For example, the default size used in Portfolio.from_signals() and Portfolio.from_orders() is np.inf:
>>> vbt.settings.portfolio['size']
inf
Grouping
One of the key features of Portfolio is the ability to group columns. Groups can be specified by group_by, which can be anything from positions or names of column levels, to a NumPy array with actual groups. Groups can be formed to share capital between columns (make sure to pass cash_sharing=True) or to compute metrics for a combined portfolio of multiple independent columns.
For example, let's divide our portfolio into two groups sharing the same cash balance:
>>> # Simulate combined portfolio
>>> group_by = pd.Index([
...     'first', 'first', 'first',
...     'second', 'second', 'second'
... ], name='group')
>>> comb_pf = vbt.Portfolio.from_orders(
...     ohlcv['Close'], size, price=ohlcv['Open'],
...     init_cash='autoalign', fees=0.001, slippage=0.001,
...     group_by=group_by, cash_sharing=True)

>>> # Get total profit per group
>>> comb_pf.total_profit()
group
first     26221.571200
second    10141.952674
Name: total_profit, dtype: float64
Not only can we analyze each group, but also each column in the group:
>>> # Get total profit per column
>>> comb_pf.total_profit(group_by=False)
symbol
BTC-USD     5792.120252
ETH-USD    16380.039692
XRP-USD     4049.411256
BNB-USD     6081.253551
BCH-USD      400.573418
LTC-USD     3660.125705
Name: total_profit, dtype: float64
In the same way, we can introduce new grouping to the method itself:
>>> # Get total profit per group
>>> pf.total_profit(group_by=group_by)
group
first     26221.571200
second    10141.952674
Name: total_profit, dtype: float64
Note
If cash sharing is enabled, grouping can be disabled but cannot be modified.
Indexing
Like any other class subclassing Wrapping, we can do pandas indexing on a Portfolio instance, which forwards indexing operation to each object with columns:
>>> pf['BTC-USD']
<vectorbt.portfolio.base.Portfolio at 0x7fac7517ac88>

>>> pf['BTC-USD'].total_profit()
5792.120252189081
Combined portfolio is indexed by group:
>>> comb_pf['first']
<vectorbt.portfolio.base.Portfolio at 0x7fac5756b828>

>>> comb_pf['first'].total_profit()
26221.57120014546
Note
Changing index (time axis) is not supported. The object should be treated as a Series rather than a DataFrame; for example, use pf.iloc[0] instead of pf.iloc[:, 0].
Indexing behavior depends solely upon ArrayWrapper. For example, if group_select is enabled indexing will be performed on groups, otherwise on single columns. You can pass wrapper arguments with wrapper_kwargs.
Logging
To collect more information on how a specific order was processed or to be able to track the whole simulation from the beginning to the end, we can turn on logging:
>>> # Simulate portfolio with logging
>>> pf = vbt.Portfolio.from_orders(
...     ohlcv['Close'], size, price=ohlcv['Open'],
...     init_cash='autoalign', fees=0.001, slippage=0.001, log=True)

>>> pf.logs.records
        id  group  col  idx  cash    position  debt  free_cash    val_price  \
0        0      0    0    0   inf    0.000000   0.0        inf  7194.892090
1        1      0    0    1   inf    0.000000   0.0        inf  7202.551270
2        2      0    0    2   inf    0.000000   0.0        inf  6984.428711
...    ...    ...  ...  ...   ...         ...   ...        ...          ...
1461  1461      5    5  241   inf  272.389644   0.0        inf    57.207737
1462  1462      5    5  242   inf  274.137659   0.0        inf    62.844059
1463  1463      5    5  243   inf  282.093860   0.0        inf    61.105076

      value  ...  new_free_cash  new_val_price  new_value  res_size  \
0       inf  ...            inf    7194.892090        inf       NaN
1       inf  ...            inf    7202.551270        inf       NaN
2       inf  ...            inf    6984.428711        inf       NaN
...     ...  ...            ...            ...        ...       ...
1461    inf  ...            inf      57.207737        inf  1.748015
1462    inf  ...            inf      62.844059        inf  7.956202
1463    inf  ...            inf      61.105076        inf  1.636525

        res_price  res_fees  res_side  res_status  res_status_info  order_id
0             NaN       NaN        -1           1                0        -1
1             NaN       NaN        -1           1                5        -1
2             NaN       NaN        -1           1                5        -1
...           ...       ...       ...         ...              ...       ...
1461    57.264945    0.1001         0           0               -1      1070
1462    62.906903    0.5005         0           0               -1      1071
1463    61.043971    0.0999         1           0               -1      1072

[1464 rows x 37 columns]
Just as orders, logs are also records and thus can be easily analyzed:
>>> pf.logs.res_status.value_counts()
symbol   BTC-USD  ETH-USD  XRP-USD  BNB-USD  BCH-USD  LTC-USD
Filled       184      172      177      178      177      185
Ignored       60       72       67       66       67       59
Logging can also be turned on just for one order, row, or column, since as many other variables it's specified per order and can broadcast automatically.
Note
Logging can slow down simulation.
Caching
Portfolio heavily relies upon caching. If a method or a property requires heavy computation, it's wrapped with cached_method() and cached_property respectively. Caching can be disabled globally via caching in settings.
Note
Because of caching, class is meant to be immutable and all properties are read-only. To change any attribute, use the copy method and pass the attribute as keyword argument.
Alternatively, we can precisely point at attributes and methods that should or shouldn't be cached. For example, we can blacklist the entire Portfolio class except a few most called methods such as Portfolio.cash_flow() and Portfolio.asset_flow():
>>> vbt.settings.caching['blacklist'].append(
...     vbt.CacheCondition(base_cls='Portfolio')
... )
>>> vbt.settings.caching['whitelist'].extend([
...     vbt.CacheCondition(base_cls='Portfolio', func='cash_flow'),
...     vbt.CacheCondition(base_cls='Portfolio', func='asset_flow')
... ])
Define rules for one instance of Portfolio:
>>> vbt.settings.caching['blacklist'].append(
...     vbt.CacheCondition(instance=pf)
... )
>>> vbt.settings.caching['whitelist'].extend([
...     vbt.CacheCondition(instance=pf, func='cash_flow'),
...     vbt.CacheCondition(instance=pf, func='asset_flow')
... ])
See should_cache() for caching rules.
To reset caching:
>>> vbt.settings.caching.reset()
Performance and memory
If you're running out of memory when working with large arrays, make sure to disable caching and then store most important time series manually. For example, if you're interested in Sharpe ratio or other metrics based on returns, run and save Portfolio.returns() in a variable and then use the ReturnsAccessor to analyze them. Do not use methods akin to Portfolio.sharpe_ratio() because they will re-calculate returns each time.
Alternatively, you can track portfolio value and returns using Portfolio.from_order_func() and its callbacks (preferably in post_segment_func_nb):
>>> pf_baseline = vbt.Portfolio.from_orders(
...     ohlcv['Close'], size, price=ohlcv['Open'],
...     init_cash='autoalign', fees=0.001, slippage=0.001, freq='d')
>>> pf_baseline.sharpe_ratio()
symbol
BTC-USD    1.743437
ETH-USD    2.800903
XRP-USD    1.607904
BNB-USD    1.805373
BCH-USD    0.269392
LTC-USD    1.040494
Name: sharpe_ratio, dtype: float64

>>> @njit
... def order_func_nb(c, size, price, fees, slippage):
...     return nb.order_nb(
...         size=nb.get_elem_nb(c, size),
...         price=nb.get_elem_nb(c, price),
...         fees=nb.get_elem_nb(c, fees),
...         slippage=nb.get_elem_nb(c, slippage),
...     )

>>> @njit
... def post_segment_func_nb(c, returns_out):
...     returns_out[c.i, c.group] = c.last_return[c.group]

>>> returns_out = np.empty_like(ohlcv['Close'], dtype=np.float64)
>>> pf = vbt.Portfolio.from_order_func(
...     ohlcv['Close'],
...     order_func_nb,
...     np.asarray(size),
...     np.asarray(ohlcv['Open']),
...     np.asarray(0.001),
...     np.asarray(0.001),
...     post_segment_func_nb=post_segment_func_nb,
...     post_segment_args=(returns_out,),
...     init_cash=pf_baseline.init_cash
... )

>>> returns = pf.wrapper.wrap(returns_out)
>>> del pf
>>> returns.vbt.returns(freq='d').sharpe_ratio()
symbol
BTC-USD   -2.261443
ETH-USD    0.059538
XRP-USD    2.159093
BNB-USD    1.555386
BCH-USD    0.784214
LTC-USD    1.460077
Name: sharpe_ratio, dtype: float64
The only drawback of this approach is that you cannot use init_cash='auto' or init_cash='autoalign' because then, during the simulation, the portfolio value is np.inf and the returns are np.nan.
Saving and loading
Like any other class subclassing Pickleable, we can save a Portfolio instance to the disk with Pickleable.save() and load it with Pickleable.load():
>>> pf = vbt.Portfolio.from_orders(
...     ohlcv['Close'], size, price=ohlcv['Open'],
...     init_cash='autoalign', fees=0.001, slippage=0.001, freq='d')
>>> pf.sharpe_ratio()
symbol
BTC-USD    1.743437
ETH-USD    2.800903
XRP-USD    1.607904
BNB-USD    1.805373
BCH-USD    0.269392
LTC-USD    1.040494
Name: sharpe_ratio, dtype: float64

>>> pf.save('my_pf')
>>> pf = vbt.Portfolio.load('my_pf')
>>> pf.sharpe_ratio()
symbol
BTC-USD    1.743437
ETH-USD    2.800903
XRP-USD    1.607904
BNB-USD    1.805373
BCH-USD    0.269392
LTC-USD    1.040494
Name: sharpe_ratio, dtype: float64
Note
Save files won't include neither cached results nor global defaults. For example, passing fillna_close as None will also use None when the portfolio is loaded from disk. Make sure to either pass all arguments explicitly or to also save the settings config.
Stats
Hint
Let's simulate a portfolio with two columns:
>>> close = vbt.YFData.download(
...     "BTC-USD",
...     start='2020-01-01 UTC',
...     end='2020-09-01 UTC'
... ).get('Close')

>>> pf = vbt.Portfolio.from_random_signals(close, n=[10, 20], seed=42)
>>> pf.wrapper.columns
Index([10, 20], dtype='int64', name='rand_n')
Column, group, and tag selection
To return the statistics for a particular column/group, use the column argument:
>>> pf.stats(column=10)
UserWarning: Metric 'sharpe_ratio' requires frequency to be set
UserWarning: Metric 'calmar_ratio' requires frequency to be set
UserWarning: Metric 'omega_ratio' requires frequency to be set
UserWarning: Metric 'sortino_ratio' requires frequency to be set

Start                         2020-01-01 00:00:00+00:00
End                           2020-09-01 00:00:00+00:00
Period                                              244
Start Value                                       100.0
End Value                                    106.721585
Total Return [%]                               6.721585
Benchmark Return [%]                          66.252621
Max Gross Exposure [%]                            100.0
Total Fees Paid                                     0.0
Max Drawdown [%]                              22.190944
Max Drawdown Duration                             101.0
Total Trades                                         10
Total Closed Trades                                  10
Total Open Trades                                     0
Open Trade PnL                                      0.0
Win Rate [%]                                       60.0
Best Trade [%]                                 15.31962
Worst Trade [%]                               -9.904223
Avg Winning Trade [%]                          4.671959
Avg Losing Trade [%]                          -4.851205
Avg Winning Trade Duration                    11.333333
Avg Losing Trade Duration                         14.25
Profit Factor                                  1.347457
Expectancy                                     0.672158
Name: 10, dtype: object
If vectorbt couldn't parse the frequency of close:
1) it won't return any duration in time units, 2) it won't return any metric that requires annualization, and 3) it will throw a bunch of warnings (you can silence those by passing silence_warnings=True)
We can provide the frequency as part of the settings dict:
>>> pf.stats(column=10, settings=dict(freq='d'))
UserWarning: Changing the frequency will create a copy of this object.
Consider setting the frequency upon object creation to re-use existing cache.

Start                         2020-01-01 00:00:00+00:00
End                           2020-09-01 00:00:00+00:00
Period                                244 days 00:00:00
Start Value                                       100.0
End Value                                    106.721585
Total Return [%]                               6.721585
Benchmark Return [%]                          66.252621
Max Gross Exposure [%]                            100.0
Total Fees Paid                                     0.0
Max Drawdown [%]                              22.190944
Max Drawdown Duration                 101 days 00:00:00
Total Trades                                         10
Total Closed Trades                                  10
Total Open Trades                                     0
Open Trade PnL                                      0.0
Win Rate [%]                                       60.0
Best Trade [%]                                 15.31962
Worst Trade [%]                               -9.904223
Avg Winning Trade [%]                          4.671959
Avg Losing Trade [%]                          -4.851205
Avg Winning Trade Duration             11 days 08:00:00
Avg Losing Trade Duration              14 days 06:00:00
Profit Factor                                  1.347457
Expectancy                                     0.672158
Sharpe Ratio                                   0.445231
Calmar Ratio                                   0.460573
Omega Ratio                                    1.099192
Sortino Ratio                                  0.706986
Name: 10, dtype: object
But in this case, our portfolio will be copied to set the new frequency and we wouldn't be able to re-use its cached attributes. Let's define the frequency upon the simulation instead:
>>> pf = vbt.Portfolio.from_random_signals(close, n=[10, 20], seed=42, freq='d')
We can change the grouping of the portfolio on the fly. Let's form a single group:
>>> pf.stats(group_by=True)
Start                         2020-01-01 00:00:00+00:00
End                           2020-09-01 00:00:00+00:00
Period                                244 days 00:00:00
Start Value                                       200.0
End Value                                     277.49299
Total Return [%]                              38.746495
Benchmark Return [%]                          66.252621
Max Gross Exposure [%]                            100.0
Total Fees Paid                                     0.0
Max Drawdown [%]                              14.219327
Max Drawdown Duration                  86 days 00:00:00
Total Trades                                         30
Total Closed Trades                                  30
Total Open Trades                                     0
Open Trade PnL                                      0.0
Win Rate [%]                                  66.666667
Best Trade [%]                                18.332559
Worst Trade [%]                               -9.904223
Avg Winning Trade [%]                          5.754788
Avg Losing Trade [%]                          -4.718907
Avg Winning Trade Duration              7 days 19:12:00
Avg Losing Trade Duration               8 days 07:12:00
Profit Factor                                  2.427948
Expectancy                                       2.5831
Sharpe Ratio                                    1.57907
Calmar Ratio                                   4.445448
Omega Ratio                                    1.334032
Sortino Ratio                                   2.59669
Name: group, dtype: object
We can see how the initial cash has changed from $100 to $200, indicating that both columns now contribute to the performance.
Aggregation
If the portfolio consists of multiple columns/groups and no column/group has been selected, each metric is aggregated across all columns/groups based on agg_func, which is np.mean by default.
>>> pf.stats()
UserWarning: Object has multiple columns. Aggregating using <function mean at 0x7fc77152bb70>.
Pass column to select a single column/group.

Start                         2020-01-01 00:00:00+00:00
End                           2020-09-01 00:00:00+00:00
Period                                244 days 00:00:00
Start Value                                       100.0
End Value                                    138.746495
Total Return [%]                              38.746495
Benchmark Return [%]                          66.252621
Max Gross Exposure [%]                            100.0
Total Fees Paid                                     0.0
Max Drawdown [%]                               20.35869
Max Drawdown Duration                  93 days 00:00:00
Total Trades                                       15.0
Total Closed Trades                                15.0
Total Open Trades                                   0.0
Open Trade PnL                                      0.0
Win Rate [%]                                       65.0
Best Trade [%]                                 16.82609
Worst Trade [%]                               -9.701273
Avg Winning Trade [%]                          5.445408
Avg Losing Trade [%]                          -4.740956
Avg Winning Trade Duration    8 days 19:25:42.857142857
Avg Losing Trade Duration               9 days 07:00:00
Profit Factor                                  2.186957
Expectancy                                     2.105364
Sharpe Ratio                                   1.165695
Calmar Ratio                                   3.541079
Omega Ratio                                    1.331624
Sortino Ratio                                  2.084565
Name: agg_func_mean, dtype: object
Here, the Sharpe ratio of 0.445231 (column=10) and 1.88616 (column=20) lead to the avarage of 1.16569.
We can also return a DataFrame with statistics per column/group by passing agg_func=None:
>>> pf.stats(agg_func=None)
                           Start                       End   Period  ...  Sortino Ratio
rand_n                                                               ...
10     2020-01-01 00:00:00+00:00 2020-09-01 00:00:00+00:00 244 days  ...       0.706986
20     2020-01-01 00:00:00+00:00 2020-09-01 00:00:00+00:00 244 days  ...       3.462144

[2 rows x 25 columns]
Metric selection
To select metrics, use the metrics argument (see Portfolio.metrics for supported metrics):
>>> pf.stats(metrics=['sharpe_ratio', 'sortino_ratio'], column=10)
Sharpe Ratio     0.445231
Sortino Ratio    0.706986
Name: 10, dtype: float64
We can also select specific tags (see any metric from Portfolio.metrics that has the tag key):
>>> pf.stats(column=10, tags=['trades'])
Total Trades                                10
Total Open Trades                            0
Open Trade PnL                               0
Long Trades [%]                            100
Win Rate [%]                                60
Best Trade [%]                         15.3196
Worst Trade [%]                       -9.90422
Avg Winning Trade [%]                  4.67196
Avg Winning Trade Duration    11 days 08:00:00
Avg Losing Trade [%]                   -4.8512
Avg Losing Trade Duration     14 days 06:00:00
Profit Factor                          1.34746
Expectancy                            0.672158
Name: 10, dtype: object
Or provide a boolean expression:
>>> pf.stats(column=10, tags='trades and open and not closed')
Total Open Trades    0.0
Open Trade PnL       0.0
Name: 10, dtype: float64
The reason why we included "not closed" along with "open" is because some metrics such as the win rate have both tags attached since they are based upon both open and closed trades/positions (to see this, pass settings=dict(incl_open=True) and tags='trades and open').
Passing parameters
We can use settings to pass parameters used across multiple metrics. For example, let's pass required and risk-free return to all return metrics:
>>> pf.stats(column=10, settings=dict(required_return=0.1, risk_free=0.01))
Start                         2020-01-01 00:00:00+00:00
End                           2020-09-01 00:00:00+00:00
Period                                244 days 00:00:00
Start Value                                       100.0
End Value                                    106.721585
Total Return [%]                               6.721585
Benchmark Return [%]                          66.252621
Max Gross Exposure [%]                            100.0
Total Fees Paid                                     0.0
Max Drawdown [%]                              22.190944
Max Drawdown Duration                 101 days 00:00:00
Total Trades                                         10
Total Closed Trades                                  10
Total Open Trades                                     0
Open Trade PnL                                      0.0
Win Rate [%]                                       60.0
Best Trade [%]                                 15.31962
Worst Trade [%]                               -9.904223
Avg Winning Trade [%]                          4.671959
Avg Losing Trade [%]                          -4.851205
Avg Winning Trade Duration             11 days 08:00:00
Avg Losing Trade Duration              14 days 06:00:00
Profit Factor                                  1.347457
Expectancy                                     0.672158
Sharpe Ratio                                  -9.504742  << here
Calmar Ratio                                   0.460573  << here
Omega Ratio                                    0.233279  << here
Sortino Ratio                                -18.763407  << here
Name: 10, dtype: object
Passing any argument inside of settings either overrides an existing default, or acts as an optional argument that is passed to the calculation function upon resolution (see below). Both required_return and risk_free can be found in the signature of the 4 ratio methods, so vectorbt knows exactly it has to pass them.
Let's imagine that the signature of ReturnsAccessor.sharpe_ratio() doesn't list those arguments: vectorbt would simply call this method without passing those two arguments. In such case, we have two options:
1) Set parameters globally using settings and set pass_{arg}=True individually using metric_settings:
>>> pf.stats(
...     column=10,
...     settings=dict(required_return=0.1, risk_free=0.01),
...     metric_settings=dict(
...         sharpe_ratio=dict(pass_risk_free=True),
...         omega_ratio=dict(pass_required_return=True, pass_risk_free=True),
...         sortino_ratio=dict(pass_required_return=True)
...     )
... )
2) Set parameters individually using metric_settings:
>>> pf.stats(
...     column=10,
...     metric_settings=dict(
...         sharpe_ratio=dict(risk_free=0.01),
...         omega_ratio=dict(required_return=0.1, risk_free=0.01),
...         sortino_ratio=dict(required_return=0.1)
...     )
... )
Custom metrics
To calculate a custom metric, we need to provide at least two things: short name and a settings dict with the title and calculation function (see arguments in StatsBuilderMixin):
>>> max_winning_streak = (
...     'max_winning_streak',
...     dict(
...         title='Max Winning Streak',
...         calc_func=lambda trades: trades.winning_streak.max(),
...         resolve_trades=True
...     )
... )
>>> pf.stats(metrics=max_winning_streak, column=10)
Max Winning Streak    3.0
Name: 10, dtype: float64
You might wonder how vectorbt knows which arguments to pass to calc_func? In the example above, the calculation function expects two arguments: trades and group_by. To automatically pass any of the them, vectorbt searches for each in the current settings. As trades cannot be found, it either throws an error or tries to resolve this argument if resolve_{arg}=True was passed. Argument resolution is the process of searching for property/method with the same name (also with prefix get_) in the attributes of the current portfolio, automatically passing the current settings such as group_by if they are present in the method's signature (a similar resolution procedure), and calling the method/property. The result of the resolution process is then passed as arg (or trades in our example).
Here's an example without resolution of arguments:
>>> max_winning_streak = (
...     'max_winning_streak',
...     dict(
...         title='Max Winning Streak',
...         calc_func=lambda self, group_by:
...         self.get_trades(group_by=group_by).winning_streak.max()
...     )
... )
>>> pf.stats(metrics=max_winning_streak, column=10)
Max Winning Streak    3.0
Name: 10, dtype: float64
And here's an example without resolution of the calculation function:
>>> max_winning_streak = (
...     'max_winning_streak',
...     dict(
...         title='Max Winning Streak',
...         calc_func=lambda self, settings:
...         self.get_trades(group_by=settings['group_by']).winning_streak.max(),
...         resolve_calc_func=False
...     )
... )
>>> pf.stats(metrics=max_winning_streak, column=10)
Max Winning Streak    3.0
Name: 10, dtype: float64
Since max_winning_streak method can be expressed as a path from this portfolio, we can simply write:
>>> max_winning_streak = (
...     'max_winning_streak',
...     dict(
...         title='Max Winning Streak',
...         calc_func='trades.winning_streak.max'
...     )
... )
In this case, we don't have to pass resolve_trades=True any more as vectorbt does it automatically. Another advantage is that vectorbt can access the signature of the last method in the path (MappedArray.max() in our case) and resolve its arguments.
To switch between entry trades, exit trades, and positions, use the trades_type setting. Additionally, you can pass incl_open=True to also include open trades.
>>> pf.stats(column=10, settings=dict(trades_type='positions', incl_open=True))
Start                         2020-01-01 00:00:00+00:00
End                           2020-09-01 00:00:00+00:00
Period                                244 days 00:00:00
Start Value                                       100.0
End Value                                    106.721585
Total Return [%]                               6.721585
Benchmark Return [%]                          66.252621
Max Gross Exposure [%]                            100.0
Total Fees Paid                                     0.0
Max Drawdown [%]                              22.190944
Max Drawdown Duration                 100 days 00:00:00
Total Trades                                         10
Total Closed Trades                                  10
Total Open Trades                                     0
Open Trade PnL                                      0.0
Win Rate [%]                                       60.0
Best Trade [%]                                 15.31962
Worst Trade [%]                               -9.904223
Avg Winning Trade [%]                          4.671959
Avg Losing Trade [%]                          -4.851205
Avg Winning Trade Duration             11 days 08:00:00
Avg Losing Trade Duration              14 days 06:00:00
Profit Factor                                  1.347457
Expectancy                                     0.672158
Sharpe Ratio                                   0.445231
Calmar Ratio                                   0.460573
Omega Ratio                                    1.099192
Sortino Ratio                                  0.706986
Name: 10, dtype: object
Any default metric setting or even global setting can be overridden by the user using metric-specific keyword arguments. Here, we override the global aggregation function for max_dd_duration:
>>> pf.stats(agg_func=lambda sr: sr.mean(),
...     metric_settings=dict(
...         max_dd_duration=dict(agg_func=lambda sr: sr.max())
...     )
... )
UserWarning: Object has multiple columns. Aggregating using <function <lambda> at 0x7fbf6e77b268>.
Pass column to select a single column/group.

Start                         2020-01-01 00:00:00+00:00
End                           2020-09-01 00:00:00+00:00
Period                                244 days 00:00:00
Start Value                                       100.0
End Value                                    138.746495
Total Return [%]                              38.746495
Benchmark Return [%]                          66.252621
Max Gross Exposure [%]                            100.0
Total Fees Paid                                     0.0
Max Drawdown [%]                               20.35869
Max Drawdown Duration                 101 days 00:00:00  << here
Total Trades                                       15.0
Total Closed Trades                                15.0
Total Open Trades                                   0.0
Open Trade PnL                                      0.0
Win Rate [%]                                       65.0
Best Trade [%]                                 16.82609
Worst Trade [%]                               -9.701273
Avg Winning Trade [%]                          5.445408
Avg Losing Trade [%]                          -4.740956
Avg Winning Trade Duration    8 days 19:25:42.857142857
Avg Losing Trade Duration               9 days 07:00:00
Profit Factor                                  2.186957
Expectancy                                     2.105364
Sharpe Ratio                                   1.165695
Calmar Ratio                                   3.541079
Omega Ratio                                    1.331624
Sortino Ratio                                  2.084565
Name: agg_func_<lambda>, dtype: object
Let's create a simple metric that returns a passed value to demonstrate how vectorbt overrides settings, from least to most important:
>>> # vbt.settings.portfolio.stats
>>> vbt.settings.portfolio.stats['settings']['my_arg'] = 100
>>> my_arg_metric = ('my_arg_metric', dict(title='My Arg', calc_func=lambda my_arg: my_arg))
>>> pf.stats(my_arg_metric, column=10)
My Arg    100
Name: 10, dtype: int64

>>> # settings >>> vbt.settings.portfolio.stats
>>> pf.stats(my_arg_metric, column=10, settings=dict(my_arg=200))
My Arg    200
Name: 10, dtype: int64

>>> # metric settings >>> settings
>>> my_arg_metric = ('my_arg_metric', dict(title='My Arg', my_arg=300, calc_func=lambda my_arg: my_arg))
>>> pf.stats(my_arg_metric, column=10, settings=dict(my_arg=200))
My Arg    300
Name: 10, dtype: int64

>>> # metric_settings >>> metric settings
>>> pf.stats(my_arg_metric, column=10, settings=dict(my_arg=200),
...     metric_settings=dict(my_arg_metric=dict(my_arg=400)))
My Arg    400
Name: 10, dtype: int64
Here's an example of a parametrized metric. Let's get the number of trades with PnL over some amount:
>>> trade_min_pnl_cnt = (
...     'trade_min_pnl_cnt',
...     dict(
...         title=vbt.Sub('Trades with PnL over $$${min_pnl}'),
...         calc_func=lambda trades, min_pnl: trades.apply_mask(
...             trades.pnl.values >= min_pnl).count(),
...         resolve_trades=True
...     )
... )
>>> pf.stats(
...     metrics=trade_min_pnl_cnt, column=10,
...     metric_settings=dict(trade_min_pnl_cnt=dict(min_pnl=0)))
Trades with PnL over $0    6
Name: stats, dtype: int64

>>> pf.stats(
...     metrics=trade_min_pnl_cnt, column=10,
...     metric_settings=dict(trade_min_pnl_cnt=dict(min_pnl=10)))
Trades with PnL over $10    1
Name: stats, dtype: int64
If the same metric name was encountered more than once, vectorbt automatically appends an underscore and its position, so we can pass keyword arguments to each metric separately:
>>> pf.stats(
...     metrics=[
...         trade_min_pnl_cnt,
...         trade_min_pnl_cnt,
...         trade_min_pnl_cnt
...     ],
...     column=10,
...     metric_settings=dict(
...         trade_min_pnl_cnt_0=dict(min_pnl=0),
...         trade_min_pnl_cnt_1=dict(min_pnl=10),
...         trade_min_pnl_cnt_2=dict(min_pnl=20))
...     )
Trades with PnL over $0     6
Trades with PnL over $10    1
Trades with PnL over $20    0
Name: stats, dtype: int64
To add a custom metric to the list of all metrics, we have three options.
The first option is to change the Portfolio.metrics dict in-place (this will append to the end):
>>> pf.metrics['max_winning_streak'] = max_winning_streak[1]
>>> pf.stats(column=10)
Start                         2020-01-01 00:00:00+00:00
End                           2020-09-01 00:00:00+00:00
Period                                244 days 00:00:00
Start Value                                       100.0
End Value                                    106.721585
Total Return [%]                               6.721585
Benchmark Return [%]                          66.252621
Max Gross Exposure [%]                            100.0
Total Fees Paid                                     0.0
Max Drawdown [%]                              22.190944
Max Drawdown Duration                 101 days 00:00:00
Total Trades                                         10
Total Closed Trades                                  10
Total Open Trades                                     0
Open Trade PnL                                      0.0
Win Rate [%]                                       60.0
Best Trade [%]                                 15.31962
Worst Trade [%]                               -9.904223
Avg Winning Trade [%]                          4.671959
Avg Losing Trade [%]                          -4.851205
Avg Winning Trade Duration             11 days 08:00:00
Avg Losing Trade Duration              14 days 06:00:00
Profit Factor                                  1.347457
Expectancy                                     0.672158
Sharpe Ratio                                   0.445231
Calmar Ratio                                   0.460573
Omega Ratio                                    1.099192
Sortino Ratio                                  0.706986
Max Winning Streak                                  3.0  << here
Name: 10, dtype: object
Since Portfolio.metrics is of type Config, we can reset it at any time to get default metrics:
>>> pf.metrics.reset()
The second option is to copy Portfolio.metrics, append our metric, and pass as metrics argument:
>>> my_metrics = list(pf.metrics.items()) + [max_winning_streak]
>>> pf.stats(metrics=my_metrics, column=10)
The third option is to set metrics globally under portfolio.stats in settings.
>>> vbt.settings.portfolio['stats']['metrics'] = my_metrics
>>> pf.stats(column=10)
Returns stats
We can compute the stats solely based on the portfolio's returns using Portfolio.returns_stats(), which calls StatsBuilderMixin.stats().
>>> pf.returns_stats(column=10)
Start                        2020-01-01 00:00:00+00:00
End                          2020-09-01 00:00:00+00:00
Period                               244 days 00:00:00
Total Return [%]                              6.721585
Benchmark Return [%]                         66.252621
Annualized Return [%]                         10.22056
Annualized Volatility [%]                    36.683518
Max Drawdown [%]                             22.190944
Max Drawdown Duration                100 days 00:00:00
Sharpe Ratio                                  0.445231
Calmar Ratio                                  0.460573
Omega Ratio                                   1.099192
Sortino Ratio                                 0.706986
Skew                                          1.328259
Kurtosis                                      10.80246
Tail Ratio                                    1.057913
Common Sense Ratio                            1.166037
Value at Risk                                -0.031011
Alpha                                        -0.075109
Beta                                          0.220351
Name: 10, dtype: object
Most metrics defined in ReturnsAccessor are also available as attributes of Portfolio:
>>> pf.sharpe_ratio()
randnx_n
10    0.445231
20    1.886158
Name: sharpe_ratio, dtype: float64
Moreover, we can access quantstats functions using QSAdapter:
>>> pf.qs.sharpe()
randnx_n
10    0.445231
20    1.886158
dtype: float64

>>> pf[10].qs.plot_snapshot()
Plots
Hint
See PlotsBuilderMixin.plots().
The features implemented in this method are very similar to StatsBuilderMixin.stats(). See also the examples under StatsBuilderMixin.stats().
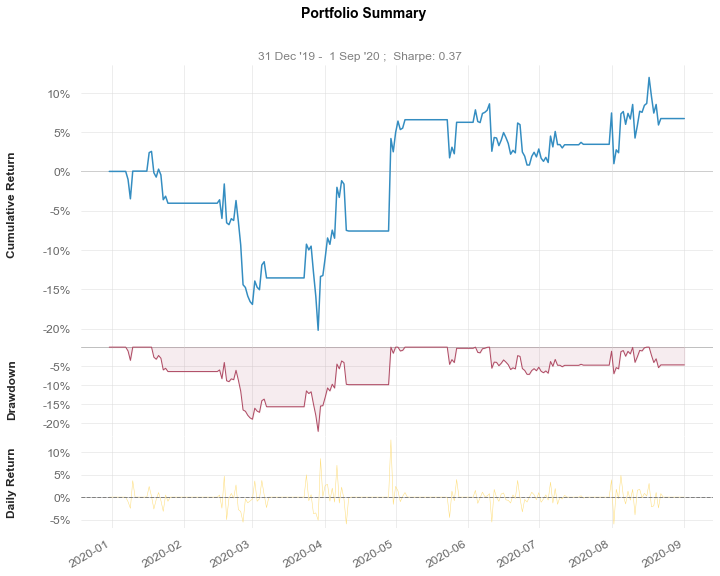
Plot portfolio of a random strategy:
>>> pf.plot(column=10)

You can choose any of the subplots in Portfolio.subplots, in any order, and control their appearance using keyword arguments:
>>> pf.plot(
...     subplots=['drawdowns', 'underwater'],
...     column=10,
...     subplot_settings=dict(
...         drawdowns=dict(top_n=3),
...         underwater=dict(
...             trace_kwargs=dict(
...                 line=dict(color='#FF6F00'),
...                 fillcolor=adjust_opacity('#FF6F00', 0.3)
...             )
...         )
...     )
... )

To create a new subplot, a preferred way is to pass a plotting function:
>>> def plot_order_size(pf, size, column=None, add_trace_kwargs=None, fig=None):
...     size = pf.select_one_from_obj(size, pf.wrapper.regroup(False), column=column)
...     size.rename('Order Size').vbt.barplot(
...         add_trace_kwargs=add_trace_kwargs, fig=fig)

>>> order_size = pf.orders.size.to_pd(fill_value=0.)
>>> pf.plot(subplots=[
...     'orders',
...     ('order_size', dict(
...         title='Order Size',
...         yaxis_kwargs=dict(title='Order size'),
...         check_is_not_grouped=True,
...         plot_func=plot_order_size
...     ))
... ],
...     column=10,
...     subplot_settings=dict(
...         order_size=dict(
...             size=order_size
...         )
...     )
... )
Alternatively, you can create a placeholder and overwrite it manually later:
>>> fig = pf.plot(subplots=[
...     'orders',
...     ('order_size', dict(
...         title='Order Size',
...         yaxis_kwargs=dict(title='Order size'),
...         check_is_not_grouped=True
...     ))  # placeholder
... ], column=10)
>>> order_size[10].rename('Order Size').vbt.barplot(
...     add_trace_kwargs=dict(row=2, col=1),
...     fig=fig
... )

If a plotting function can in any way be accessed from the current portfolio, you can pass the path to this function (see deep_getattr() for the path format). You can additionally use templates to make some parameters to depend upon passed keyword arguments:
>>> subplots = [
...     ('cumulative_returns', dict(
...         title='Cumulative Returns',
...         yaxis_kwargs=dict(title='Cumulative returns'),
...         plot_func='returns.vbt.returns.cumulative.vbt.plot',
...         pass_add_trace_kwargs=True
...     )),
...     ('rolling_drawdown', dict(
...         title='Rolling Drawdown',
...         yaxis_kwargs=dict(title='Rolling drawdown'),
...         plot_func=[
...             'returns.vbt.returns',  # returns accessor
...             (
...                 'rolling_max_drawdown',  # function name
...                 (vbt.Rep('window'),)),  # positional arguments
...             'vbt.plot'  # plotting function
...         ],
...         pass_add_trace_kwargs=True,
...         trace_names=[vbt.Sub('rolling_drawdown(${window})')],  # add window to the trace name
...     ))
... ]
>>> pf.plot(
...     subplots,
...     column=10,
...     subplot_settings=dict(
...         rolling_drawdown=dict(
...             template_mapping=dict(
...                 window=10
...             )
...         )
...     )
... )
You can also replace templates across all subplots by using the global template mapping:
>>> pf.plot(subplots, column=10, template_mapping=dict(window=10))

returns_acc_config Config
Config of returns accessor methods to be added to Portfolio.
Config({
    "daily_returns": {
        "source_name": "daily"
    },
    "annual_returns": {
        "source_name": "annual"
    },
    "cumulative_returns": {
        "source_name": "cumulative"
    },
    "annualized_return": {
        "source_name": "annualized"
    },
    "annualized_volatility": {},
    "calmar_ratio": {},
    "omega_ratio": {},
    "sharpe_ratio": {},
    "deflated_sharpe_ratio": {},
    "downside_risk": {},
    "sortino_ratio": {},
    "information_ratio": {},
    "beta": {},
    "alpha": {},
    "tail_ratio": {},
    "value_at_risk": {},
    "cond_value_at_risk": {},
    "capture": {},
    "up_capture": {},
    "down_capture": {},
    "drawdown": {},
    "max_drawdown": {}
})
MetaPortfolio class
MetaPortfolio(
    *args,
    **kwargs
)
Meta class that exposes a read-only class property StatsBuilderMixin.metrics.
Superclasses
- MetaPlotsBuilderMixin
- MetaStatsBuilderMixin
builtins.type
Inherited members
Portfolio class
Portfolio(
    wrapper,
    close,
    order_records,
    log_records,
    init_cash,
    cash_sharing,
    call_seq=None,
    fillna_close=None,
    trades_type=None,
    engine=None
)
Class for modeling portfolio and measuring its performance.
Args
wrapper:ArrayWrapper-
Array wrapper.
See ArrayWrapper.
close:array_like- Last asset price at each time step.
order_records:array_like- A structured NumPy array of order records.
log_records:array_like- A structured NumPy array of log records.
init_cash:InitCashMode,floatorarray_likeoffloat- Initial capital.
cash_sharing:bool- Whether to share cash within the same group.
call_seq:array_likeofint- Sequence of calls per row and group. Defaults to None.
fillna_close:bool-
Whether to forward and backward fill NaN values in
close.Applied after the simulation to avoid NaNs in asset value.
trades_type:strorint-
Default Trades to use across Portfolio.
See TradesType.
For defaults, see portfolio in settings.
Note
Use class methods with from_ prefix to build a portfolio. The __init__ method is reserved for indexing purposes.
Note
This class is meant to be immutable. To change any attribute, use Configured.replace().
Superclasses
- AttrResolver
- Configured
- Documented
- IndexingBase
- PandasIndexer
- Pickleable
- PlotsBuilderMixin
- StatsBuilderMixin
- Wrapping
Inherited members
- AttrResolver.deep_getattr()
- AttrResolver.resolve_attr()
- Configured.copy()
- Configured.dumps()
- Configured.loads()
- Configured.replace()
- Configured.to_doc()
- Configured.update_config()
- PandasIndexer.xs()
- Pickleable.load()
- Pickleable.save()
- PlotsBuilderMixin.build_subplots_doc()
- PlotsBuilderMixin.override_subplots_doc()
- PlotsBuilderMixin.plots()
- StatsBuilderMixin.build_metrics_doc()
- StatsBuilderMixin.override_metrics_doc()
- StatsBuilderMixin.stats()
- Wrapping.config
- Wrapping.iloc
- Wrapping.indexing_kwargs
- Wrapping.loc
- Wrapping.resolve_self()
- Wrapping.select_one()
- Wrapping.select_one_from_obj()
- Wrapping.self_aliases
- Wrapping.wrapper
- Wrapping.writeable_attrs
alpha method
Portfolio.alpha(
    *,
    group_by=None,
    benchmark_rets=None,
    freq=None,
    year_freq=None,
    use_asset_returns=False,
    **kwargs
)
annual_returns method
Portfolio.annual_returns(
    *,
    group_by=None,
    benchmark_rets=None,
    freq=None,
    year_freq=None,
    use_asset_returns=False,
    **kwargs
)
annualized_return method
Portfolio.annualized_return(
    *,
    group_by=None,
    benchmark_rets=None,
    freq=None,
    year_freq=None,
    use_asset_returns=False,
    **kwargs
)
See ReturnsAccessor.annualized().
annualized_volatility method
Portfolio.annualized_volatility(
    *,
    group_by=None,
    benchmark_rets=None,
    freq=None,
    year_freq=None,
    use_asset_returns=False,
    **kwargs
)
See ReturnsAccessor.annualized_volatility().
asset_flow method
Portfolio.asset_flow(
    direction='both',
    wrap_kwargs=None,
    engine=None
)
Get asset flow series per column.
Returns the total transacted amount of assets at each time step.
asset_returns method
Portfolio.asset_returns(
    group_by=None,
    wrap_kwargs=None,
    engine=None
)
Get asset return series per column/group.
This type of returns is based solely on cash flows and asset value rather than portfolio value. It ignores passive cash and thus it will return the same numbers irrespective of the amount of cash currently available, even np.inf. The scale of returns is comparable to that of going all in and keeping available cash at zero.
asset_value method
Portfolio.asset_value(
    direction='both',
    group_by=None,
    wrap_kwargs=None,
    engine=None
)
Get asset value series per column/group.
assets method
Portfolio.assets(
    direction='both',
    wrap_kwargs=None,
    engine=None
)
Get asset series per column.
Returns the current position at each time step.
benchmark_rets method
Portfolio.benchmark_returns(
    group_by=None,
    wrap_kwargs=None,
    engine=None
)
Get return series per column/group based on benchmark value.
benchmark_returns method
Portfolio.benchmark_returns(
    group_by=None,
    wrap_kwargs=None,
    engine=None
)
Get return series per column/group based on benchmark value.
benchmark_value method
Portfolio.benchmark_value(
    group_by=None,
    wrap_kwargs=None,
    engine=None
)
Get market benchmark value series per column/group.
If grouped, evenly distributes the initial cash among assets in the group.
Note
Does not take into account fees and slippage. For this, create a separate portfolio.
beta method
Portfolio.beta(
    *,
    group_by=None,
    benchmark_rets=None,
    freq=None,
    year_freq=None,
    use_asset_returns=False,
    **kwargs
)
call_seq property
Sequence of calls per row and group.
calmar_ratio method
Portfolio.calmar_ratio(
    *,
    group_by=None,
    benchmark_rets=None,
    freq=None,
    year_freq=None,
    use_asset_returns=False,
    **kwargs
)
See ReturnsAccessor.calmar_ratio().
capture method
Portfolio.capture(
    *,
    group_by=None,
    benchmark_rets=None,
    freq=None,
    year_freq=None,
    use_asset_returns=False,
    **kwargs
)
See ReturnsAccessor.capture().
cash method
Portfolio.cash(
    group_by=None,
    in_sim_order=False,
    free=False,
    wrap_kwargs=None,
    engine=None
)
Get cash balance series per column/group.
See the explanation on in_sim_order in Portfolio.value(). For free, see Portfolio.cash_flow().
cash_flow method
Portfolio.cash_flow(
    group_by=None,
    free=False,
    wrap_kwargs=None,
    engine=None
)
Get cash flow series per column/group.
Use free to return the flow of the free cash, which never goes above the initial level, because an operation always costs money.
cash_sharing property
Whether to share cash within the same group.
close property
Price per unit series.
cond_value_at_risk method
Portfolio.cond_value_at_risk(
    *,
    group_by=None,
    benchmark_rets=None,
    freq=None,
    year_freq=None,
    use_asset_returns=False,
    **kwargs
)
See ReturnsAccessor.cond_value_at_risk().
cumulative_returns method
Portfolio.cumulative_returns(
    *,
    group_by=None,
    benchmark_rets=None,
    freq=None,
    year_freq=None,
    use_asset_returns=False,
    **kwargs
)
See ReturnsAccessor.cumulative().
daily_returns method
Portfolio.daily_returns(
    *,
    group_by=None,
    benchmark_rets=None,
    freq=None,
    year_freq=None,
    use_asset_returns=False,
    **kwargs
)
deflated_sharpe_ratio method
Portfolio.deflated_sharpe_ratio(
    *,
    group_by=None,
    benchmark_rets=None,
    freq=None,
    year_freq=None,
    use_asset_returns=False,
    **kwargs
)
See ReturnsAccessor.deflated_sharpe_ratio().
down_capture method
Portfolio.down_capture(
    *,
    group_by=None,
    benchmark_rets=None,
    freq=None,
    year_freq=None,
    use_asset_returns=False,
    **kwargs
)
See ReturnsAccessor.down_capture().
downside_risk method
Portfolio.downside_risk(
    *,
    group_by=None,
    benchmark_rets=None,
    freq=None,
    year_freq=None,
    use_asset_returns=False,
    **kwargs
)
See ReturnsAccessor.downside_risk().
drawdown method
Portfolio.drawdown(
    *,
    group_by=None,
    benchmark_rets=None,
    freq=None,
    year_freq=None,
    use_asset_returns=False,
    **kwargs
)
See ReturnsAccessor.drawdown().
drawdowns method
Portfolio.get_drawdowns() with default arguments.
engine property
Engine preference for dispatch functions.
entry_trades method
Portfolio.get_entry_trades() with default arguments.
exit_trades method
Portfolio.get_exit_trades() with default arguments.
fillna_close property
Whether to forward-backward fill NaN values in Portfolio.close.
final_value method
Portfolio.final_value(
    group_by=None,
    wrap_kwargs=None,
    engine=None
)
Get total profit per column/group.
from_holding class method
Portfolio.from_holding(
    close,
    **kwargs
)
Simulate portfolio from holding.
Based on Portfolio.from_signals().
>>> close = pd.Series([1, 2, 3, 4, 5])
>>> pf = vbt.Portfolio.from_holding(close)
>>> pf.final_value()
500.0
from_order_func class method
Portfolio.from_order_func(
    close,
    order_func_nb,
    *order_args,
    flexible=None,
    init_cash=None,
    cash_sharing=None,
    call_seq=None,
    segment_mask=None,
    call_pre_segment=None,
    call_post_segment=None,
    pre_sim_func_nb=no_pre_func_nb,
    pre_sim_args=(),
    post_sim_func_nb=no_post_func_nb,
    post_sim_args=(),
    pre_group_func_nb=no_pre_func_nb,
    pre_group_args=(),
    post_group_func_nb=no_post_func_nb,
    post_group_args=(),
    pre_row_func_nb=no_pre_func_nb,
    pre_row_args=(),
    post_row_func_nb=no_post_func_nb,
    post_row_args=(),
    pre_segment_func_nb=no_pre_func_nb,
    pre_segment_args=(),
    post_segment_func_nb=no_post_func_nb,
    post_segment_args=(),
    post_order_func_nb=no_post_func_nb,
    post_order_args=(),
    ffill_val_price=None,
    update_value=None,
    fill_pos_record=None,
    init_temp_records=None,
    row_wise=None,
    use_numba=None,
    max_orders=None,
    max_logs=None,
    seed=None,
    group_by=None,
    broadcast_named_args=None,
    broadcast_kwargs=None,
    template_mapping=None,
    wrapper_kwargs=None,
    freq=None,
    attach_call_seq=None,
    **kwargs
)
Build portfolio from a custom order function.
Hint
See simulate_nb() for illustrations and argument definitions.
For more details on individual simulation functions:
- not
row_wiseand notflexible: See simulate_nb() - not
row_wiseandflexible: See flex_simulate_nb() row_wiseand notflexible: See simulate_row_wise_nb()row_wiseandflexible: See flex_simulate_row_wise_nb()
Args
close:array_like-
Last asset price at each time step. Will broadcast to
target_shape.Used for calculating unrealized PnL and portfolio value.
order_func_nb:callable- Order generation function.
*order_args- Arguments passed to
order_func_nb. flexible:bool-
Whether to simulate using a flexible order function.
This lifts the limit of one order per tick and symbol.
init_cash:InitCashMode,floatorarray_likeoffloat-
Initial capital.
See
init_cashin Portfolio.from_orders(). cash_sharing:bool-
Whether to share cash within the same group.
If
group_byis None,group_bybecomes True to form a single group with cash sharing. call_seq:CallSeqTypeorarray_like-
Default sequence of calls per row and group.
- Use CallSeqType to select a sequence type.
- Set to array to specify custom sequence. Will not broadcast.
Note
CallSeqType.Auto should be implemented manually. Use sort_call_seq_nb() or sort_call_seq_out_nb() in
pre_segment_func_nb. segment_mask:intorarray_likeofbool-
Mask of whether a particular segment should be executed.
Supplying an integer will activate every n-th row. Supplying a boolean or an array of boolean will broadcast to the number of rows and groups.
Does not broadcast together with
closeandbroadcast_named_args, only against the final shape. call_pre_segment:bool- Whether to call
pre_segment_func_nbregardless ofsegment_mask. call_post_segment:bool- Whether to call
post_segment_func_nbregardless ofsegment_mask. pre_sim_func_nb:callable- Function called before simulation. Defaults to no_pre_func_nb().
pre_sim_args:tuple- Packed arguments passed to
pre_sim_func_nb. Defaults to(). post_sim_func_nb:callable- Function called after simulation. Defaults to no_post_func_nb().
post_sim_args:tuple- Packed arguments passed to
post_sim_func_nb. Defaults to(). pre_group_func_nb:callable-
Function called before each group. Defaults to no_pre_func_nb().
Called only if
row_wiseis False. pre_group_args:tuple- Packed arguments passed to
pre_group_func_nb. Defaults to(). post_group_func_nb:callable-
Function called after each group. Defaults to no_post_func_nb().
Called only if
row_wiseis False. post_group_args:tuple- Packed arguments passed to
post_group_func_nb. Defaults to(). pre_row_func_nb:callable-
Function called before each row. Defaults to no_pre_func_nb().
Called only if
row_wiseis True. pre_row_args:tuple- Packed arguments passed to
pre_row_func_nb. Defaults to(). post_row_func_nb:callable-
Function called after each row. Defaults to no_post_func_nb().
Called only if
row_wiseis True. post_row_args:tuple- Packed arguments passed to
post_row_func_nb. Defaults to(). pre_segment_func_nb:callable- Function called before each segment. Defaults to no_pre_func_nb().
pre_segment_args:tuple- Packed arguments passed to
pre_segment_func_nb. Defaults to(). post_segment_func_nb:callable- Function called after each segment. Defaults to no_post_func_nb().
post_segment_args:tuple- Packed arguments passed to
post_segment_func_nb. Defaults to(). post_order_func_nb:callable- Callback that is called after the order has been processed.
post_order_args:tuple- Packed arguments passed to
post_order_func_nb. Defaults to(). ffill_val_price:bool-
Whether to track valuation price only if it's known.
Otherwise, unknown
closewill lead to NaN in valuation price at the next timestamp. update_value:bool- Whether to update group value after each filled order.
fill_pos_record:bool-
Whether to fill position record.
Disable this to make simulation a bit faster for simple use cases.
row_wise:bool- Whether to iterate over rows rather than columns/groups.
use_numba:bool-
Whether to run the main simulation function using Numba.
Note
Disabling it does not disable Numba for other functions. If necessary, you should ensure that every other function does not uses Numba as well. You can do this by using the
py_funcattribute of that function. Or, you could disable Numba globally by doingos.environ['NUMBA_DISABLE_JIT'] = '1'. max_orders:int-
Size of the order records array. Defaults to the number of elements in the broadcasted shape.
Set to a lower number if you run out of memory.
max_logs:int-
Size of the log records array. Defaults to the number of elements in the broadcasted shape.
Set to a lower number if you run out of memory.
init_temp_records:bool-
Whether to initialize temporary record buffers with sentinel values.
Disabled by default for speed. Enable to expose predictable unused records to callbacks.
seed:int- See Portfolio.from_orders().
group_by:any- See Portfolio.from_orders().
broadcast_named_args:dict- See Portfolio.from_signals().
broadcast_kwargs:dict- See Portfolio.from_orders().
template_mapping:mapping- See Portfolio.from_signals().
wrapper_kwargs:dict- See Portfolio.from_orders().
freq:any- See Portfolio.from_orders().
attach_call_seq:bool- See Portfolio.from_orders().
**kwargs- Keyword arguments passed to the
__init__method.
For defaults, see portfolio in settings.
Note
All passed functions should be Numba-compiled if Numba is enabled.
Also see notes on Portfolio.from_orders().
Note
In contrast to other methods, the valuation price is previous close instead of the order price since the price of an order is unknown before the call (which is more realistic by the way). You can still override the valuation price in pre_segment_func_nb.
Usage
- Buy 10 units each tick using closing price:
>>> @njit
... def order_func_nb(c, size):
...     return nb.order_nb(size=size)

>>> close = pd.Series([1, 2, 3, 4, 5])
>>> pf = vbt.Portfolio.from_order_func(close, order_func_nb, 10)

>>> pf.assets()
0    10.0
1    20.0
2    30.0
3    40.0
4    40.0
dtype: float64
>>> pf.cash()
0    90.0
1    70.0
2    40.0
3     0.0
4     0.0
dtype: float64
- Reverse each position by first closing it. Keep state of last position to determine which position to open next (just as an example, there are easier ways to do this):
>>> @njit
... def pre_group_func_nb(c):
...     last_pos_state = np.array([-1])
...     return (last_pos_state,)

>>> @njit
... def order_func_nb(c, last_pos_state):
...     if c.position_now != 0:
...         return nb.close_position_nb()
...
...     if last_pos_state[0] == 1:
...         size = -np.inf  # open short
...         last_pos_state[0] = -1
...     else:
...         size = np.inf  # open long
...         last_pos_state[0] = 1
...     return nb.order_nb(size=size)

>>> pf = vbt.Portfolio.from_order_func(
...     close,
...     order_func_nb,
...     pre_group_func_nb=pre_group_func_nb
... )

>>> pf.assets()
0    100.000000
1      0.000000
2    -66.666667
3      0.000000
4     26.666667
dtype: float64
>>> pf.cash()
0      0.000000
1    200.000000
2    400.000000
3    133.333333
4      0.000000
dtype: float64
- Equal-weighted portfolio as in the example under simulate_nb():
>>> @njit
... def pre_group_func_nb(c):
...     order_value_out = np.empty(c.group_len, dtype=np.float64)
...     return (order_value_out,)

>>> @njit
... def pre_segment_func_nb(c, order_value_out, size, price, size_type, direction):
...     for col in range(c.from_col, c.to_col):
...         c.last_val_price[col] = nb.get_col_elem_nb(c, col, price)
...     nb.sort_call_seq_nb(c, size, size_type, direction, order_value_out)
...     return ()

>>> @njit
... def order_func_nb(c, size, price, size_type, direction, fees, fixed_fees, slippage):
...     return nb.order_nb(
...         size=nb.get_elem_nb(c, size),
...         price=nb.get_elem_nb(c, price),
...         size_type=nb.get_elem_nb(c, size_type),
...         direction=nb.get_elem_nb(c, direction),
...         fees=nb.get_elem_nb(c, fees),
...         fixed_fees=nb.get_elem_nb(c, fixed_fees),
...         slippage=nb.get_elem_nb(c, slippage)
...     )

>>> np.random.seed(42)
>>> close = np.random.uniform(1, 10, size=(5, 3))
>>> size_template = vbt.RepEval('np.asarray(1 / group_lens[0])')

>>> pf = vbt.Portfolio.from_order_func(
...     close,
...     order_func_nb,
...     size_template,  # order_args as *args
...     vbt.Rep('price'),
...     vbt.Rep('size_type'),
...     vbt.Rep('direction'),
...     vbt.Rep('fees'),
...     vbt.Rep('fixed_fees'),
...     vbt.Rep('slippage'),
...     segment_mask=2,  # rebalance every second tick
...     pre_group_func_nb=pre_group_func_nb,
...     pre_segment_func_nb=pre_segment_func_nb,
...     pre_segment_args=(
...         size_template,
...         vbt.Rep('price'),
...         vbt.Rep('size_type'),
...         vbt.Rep('direction')
...     ),
...     broadcast_named_args=dict(  # broadcast against each other
...         price=close,
...         size_type=SizeType.TargetPercent,
...         direction=Direction.LongOnly,
...         fees=0.001,
...         fixed_fees=1.,
...         slippage=0.001
...     ),
...     template_mapping=dict(np=np),  # required by size_template
...     cash_sharing=True, group_by=True,  # one group with cash sharing
... )

>>> pf.asset_value(group_by=False).vbt.plot()

Templates are a very powerful tool to prepare any custom arguments after they are broadcast and before they are passed to the simulation function. In the example above, we use broadcast_named_args to broadcast some arguments against each other and templates to pass those objects to callbacks. Additionally, we used an evaluation template to compute the size based on the number of assets in each group.
You may ask: why should we bother using broadcasting and templates if we could just pass size=1/3? Because of flexibility those features provide: we can now pass whatever parameter combinations we want and it will work flawlessly. For example, to create two groups of equally-allocated positions, we need to change only two parameters:
>>> close = np.random.uniform(1, 10, size=(5, 6))  # 6 columns instead of 3
>>> group_by = ['g1', 'g1', 'g1', 'g2', 'g2', 'g2']  # 2 groups instead of 1

>>> pf['g1'].asset_value(group_by=False).vbt.plot()
>>> pf['g2'].asset_value(group_by=False).vbt.plot()


- Combine multiple exit conditions. Exit early if the price hits some threshold before an actual exit:
>>> @njit
... def pre_sim_func_nb(c):
...     # We need to define stop price per column once
...     stop_price = np.full(c.target_shape[1], np.nan, dtype=np.float64)
...     return (stop_price,)

>>> @njit
... def order_func_nb(c, stop_price, entries, exits, size):
...     # Select info related to this order
...     entry_now = nb.get_elem_nb(c, entries)
...     exit_now = nb.get_elem_nb(c, exits)
...     size_now = nb.get_elem_nb(c, size)
...     price_now = nb.get_elem_nb(c, c.close)
...     stop_price_now = stop_price[c.col]
...
...     # Our logic
...     if entry_now:
...         if c.position_now == 0:
...             return nb.order_nb(
...                 size=size_now,
...                 price=price_now,
...                 direction=Direction.LongOnly)
...     elif exit_now or price_now >= stop_price_now:
...         if c.position_now > 0:
...             return nb.order_nb(
...                 size=-size_now,
...                 price=price_now,
...                 direction=Direction.LongOnly)
...     return NoOrder

>>> @njit
... def post_order_func_nb(c, stop_price, stop):
...     # Same broadcasting as for size
...     stop_now = nb.get_elem_nb(c, stop)
...
...     if c.order_result.status == OrderStatus.Filled:
...         if c.order_result.side == OrderSide.Buy:
...             # Position entered: Set stop condition
...             stop_price[c.col] = (1 + stop_now) * c.order_result.price
...         else:
...             # Position exited: Remove stop condition
...             stop_price[c.col] = np.nan

>>> def simulate(close, entries, exits, size, threshold):
...     return vbt.Portfolio.from_order_func(
...         close,
...         order_func_nb,
...         vbt.Rep('entries'), vbt.Rep('exits'), vbt.Rep('size'),  # order_args
...         pre_sim_func_nb=pre_sim_func_nb,
...         post_order_func_nb=post_order_func_nb,
...         post_order_args=(vbt.Rep('threshold'),),
...         broadcast_named_args=dict(  # broadcast against each other
...             entries=entries,
...             exits=exits,
...             size=size,
...             threshold=threshold
...         )
...     )

>>> close = pd.Series([10, 11, 12, 13, 14])
>>> entries = pd.Series([True, True, False, False, False])
>>> exits = pd.Series([False, False, False, True, True])
>>> simulate(close, entries, exits, np.inf, 0.1).asset_flow()
0    10.0
1     0.0
2   -10.0
3     0.0
4     0.0
dtype: float64

>>> simulate(close, entries, exits, np.inf, 0.2).asset_flow()
0    10.0
1     0.0
2   -10.0
3     0.0
4     0.0
dtype: float64

>>> simulate(close, entries, exits, np.nan).asset_flow()
0    10.0
1     0.0
2     0.0
3   -10.0
4     0.0
dtype: float64
The reason why stop of 10% does not result in an order at the second time step is because it comes at the same time as entry, so it must wait until no entry is present. This can be changed by replacing the statement "elif" with "if", which would execute an exit regardless if an entry is present (similar to using ConflictMode.Opposite in Portfolio.from_signals()).
We can also test the parameter combinations above all at once (thanks to broadcasting):
>>> size = pd.DataFrame(
...     [[0.1, 0.2, np.nan]],
...     columns=pd.Index(['0.1', '0.2', 'nan'], name='size')
... )
>>> simulate(close, entries, exits, np.inf, size).asset_flow()
size   0.1   0.2   nan
0     10.0  10.0  10.0
1      0.0   0.0   0.0
2    -10.0 -10.0   0.0
3      0.0   0.0 -10.0
4      0.0   0.0   0.0
- Let's illustrate how to generate multiple orders per symbol and bar. For each bar, buy at open and sell at close:
>>> @njit
... def flex_order_func_nb(c, open, size):
...     if c.call_idx == 0:
...         return c.from_col, nb.order_nb(size=size, price=open[c.i, c.from_col])
...     if c.call_idx == 1:
...         return c.from_col, nb.close_position_nb(price=c.close[c.i, c.from_col])
...     return -1, NoOrder

>>> open = pd.DataFrame({'a': [1, 2, 3], 'b': [4, 5, 6]})
>>> close = pd.DataFrame({'a': [2, 3, 4], 'b': [3, 4, 5]})
>>> size = 1
>>> pf = vbt.Portfolio.from_order_func(
...     close,
...     flex_order_func_nb,
...     to_2d_array(open), size,
...     flexible=True, max_orders=close.shape[0] * close.shape[1] * 2)

>>> pf.orders.records_readable
    Order Id  Timestamp Column  Size  Price  Fees  Side
0          0          0      a   1.0    1.0   0.0   Buy
1          1          0      a   1.0    2.0   0.0  Sell
2          2          1      a   1.0    2.0   0.0   Buy
3          3          1      a   1.0    3.0   0.0  Sell
4          4          2      a   1.0    3.0   0.0   Buy
5          5          2      a   1.0    4.0   0.0  Sell
6          6          0      b   1.0    4.0   0.0   Buy
7          7          0      b   1.0    3.0   0.0  Sell
8          8          1      b   1.0    5.0   0.0   Buy
9          9          1      b   1.0    4.0   0.0  Sell
10        10          2      b   1.0    6.0   0.0   Buy
11        11          2      b   1.0    5.0   0.0  Sell
Warning
Each bar is effectively a black box - we don't know how the price moves inside. Since trades must come in an order that replicates that of the real world, the only reliable pieces of information are the opening and the closing price.
from_orders class method
Portfolio.from_orders(
    close,
    size=None,
    size_type=None,
    direction=None,
    price=None,
    fees=None,
    fixed_fees=None,
    slippage=None,
    min_size=None,
    max_size=None,
    size_granularity=None,
    reject_prob=None,
    lock_cash=None,
    allow_partial=None,
    raise_reject=None,
    log=None,
    val_price=None,
    init_cash=None,
    cash_sharing=None,
    call_seq=None,
    ffill_val_price=None,
    update_value=None,
    max_orders=None,
    max_logs=None,
    init_temp_records=None,
    seed=None,
    group_by=None,
    broadcast_kwargs=None,
    wrapper_kwargs=None,
    freq=None,
    attach_call_seq=None,
    engine=None,
    **kwargs
)
Simulate portfolio from orders - size, price, fees, and other information.
Args
close:array_like-
Last asset price at each time step. Will broadcast.
Used for calculating unrealized PnL and portfolio value.
size:floatorarray_like- Size to order. See Order.size. Will broadcast.
size_type:SizeTypeorarray_like-
See SizeType. See Order.size_type. Will broadcast.
Note
SizeType.Percentdoes not support position reversal. Switch to a single direction.Warning
Be cautious using
SizeType.Percentwithcall_seqset to 'auto'. To execute sell orders before buy orders, the value of each order in the group needs to be approximated in advance. But sinceSizeType.Percentdepends upon the cash balance, which cannot be calculated in advance since it may change after each order, this can yield a non-optimal call sequence. direction:Directionorarray_like- See Direction. See Order.direction. Will broadcast.
price:array_likeoffloat-
Order price. See Order.price. Defaults to
np.inf. Will broadcast.Note
Make sure to use the same timestamp for all order prices in the group with cash sharing and
call_seqset toCallSeqType.Auto. fees:floatorarray_like- Fees in percentage of the order value. See Order.fees. Will broadcast.
fixed_fees:floatorarray_like- Fixed amount of fees to pay per order. See Order.fixed_fees. Will broadcast.
slippage:floatorarray_like- Slippage in percentage of price. See Order.slippage. Will broadcast.
min_size:floatorarray_like- Minimum size for an order to be accepted. See Order.min_size. Will broadcast.
max_size:floatorarray_like-
Maximum size for an order. See Order.max_size. Will broadcast.
Will be partially filled if exceeded.
size_granularity:floatorarray_like- Granularity of the size. See Order.size_granularity. Will broadcast.
reject_prob:floatorarray_like- Order rejection probability. See Order.reject_prob. Will broadcast.
lock_cash:boolorarray_like- Whether to lock cash when shorting. See Order.lock_cash. Will broadcast.
allow_partial:boolorarray_like-
Whether to allow partial fills. See Order.allow_partial. Will broadcast.
Does not apply when size is
np.inf. raise_reject:boolorarray_like- Whether to raise an exception if order gets rejected. See Order.raise_reject. Will broadcast.
log:boolorarray_like- Whether to log orders. See Order.log. Will broadcast.
val_price:array_likeoffloat-
Asset valuation price. Will broadcast.
- Any
-np.infelement is replaced by the latest valuation price (the previouscloseor the latest known valuation price ifffill_val_price). - Any
np.infelement is replaced by the current order price.
Used at the time of decision making to calculate value of each asset in the group, for example, to convert target value into target amount.
Note
In contrast to Portfolio.from_order_func(), order price is known beforehand (kind of), thus
val_priceis set to the current order price (usingnp.inf) by default. To valuate using previous close, set it in the settings to-np.inf.Note
Make sure to use timestamp for
val_pricethat comes before timestamps of all orders in the group with cash sharing (previousclosefor example), otherwise you're cheating yourself. - Any
init_cash:InitCashMode,floatorarray_likeoffloat-
Initial capital.
By default, will broadcast to the number of columns. If cash sharing is enabled, will broadcast to the number of groups. See InitCashMode to find optimal initial cash.
Note
Mode
InitCashMode.AutoAlignis applied after the portfolio is initialized to set the same initial cash for all columns/groups. Changing grouping will change the initial cash, so be aware when indexing. cash_sharing:bool-
Whether to share cash within the same group.
If
group_byis None,group_bybecomes True to form a single group with cash sharing.Warning
Introduces cross-asset dependencies.
This method presumes that in a group of assets that share the same capital all orders will be executed within the same tick and retain their price regardless of their position in the queue, even though they depend upon each other and thus cannot be executed in parallel.
call_seq:CallSeqTypeorarray_like-
Default sequence of calls per row and group.
Each value in this sequence should indicate the position of column in the group to call next. Processing of
call_seqgoes always from left to right. For example,[2, 0, 1]would first call column 'c', then 'a', and finally 'b'.- Use CallSeqType to select a sequence type.
- Set to array to specify custom sequence. Will not broadcast.
If
CallSeqType.Autoselected, rearranges calls dynamically based on order value. Calculates value of all orders per row and group, and sorts them by this value. Sell orders will be executed first to release funds for buy orders.Warning
CallSeqType.Autoshould be used with caution:- It not only presumes that order prices are known beforehand, but also that orders can be executed in arbitrary order and still retain their price. In reality, this is hardly the case: after processing one asset, some time has passed and the price for other assets might have already changed.
- Even if you're able to specify a slippage large enough to compensate for this behavior, slippage itself should depend upon execution order. This method doesn't let you do that.
- If one order is rejected, it still may execute next orders and possibly leave them without required funds.
For more control, use Portfolio.from_order_func().
ffill_val_price:bool-
Whether to track valuation price only if it's known.
Otherwise, unknown
closewill lead to NaN in valuation price at the next timestamp. update_value:bool- Whether to update group value after each filled order.
max_orders:int-
Size of the order records array. Defaults to the number of elements in the broadcasted shape.
Set to a lower number if you run out of memory.
max_logs:int-
Size of the log records array. Defaults to the number of elements in the broadcasted shape if any of the
logis True, otherwise to 1.Set to a lower number if you run out of memory.
init_temp_records:bool-
Whether to initialize temporary record buffers with sentinel values.
Disabled by default for speed. Enable to expose predictable unused records to callbacks.
seed:int- Seed to be set for both
call_seqand at the beginning of the simulation. group_by:any- Group columns. See ColumnGrouper.
broadcast_kwargs:dict- Keyword arguments passed to broadcast().
wrapper_kwargs:dict- Keyword arguments passed to ArrayWrapper.
freq:any- Index frequency in case it cannot be parsed from
close. attach_call_seq:bool-
Whether to pass
call_seqto the constructor.Makes sense if you want to analyze some metrics in the simulation order. Otherwise, just takes memory.
**kwargs- Keyword arguments passed to the
__init__method.
All broadcastable arguments will broadcast using broadcast() but keep original shape to utilize flexible indexing and to save memory.
For defaults, see portfolio in settings.
Note
When call_seq is not CallSeqType.Auto, at each timestamp, processing of the assets in a group goes strictly in order defined in call_seq. This order can't be changed dynamically.
This has one big implication for this particular method: the last asset in the call stack cannot be processed until other assets are processed. This is the reason why rebalancing cannot work properly in this setting: one has to specify percentages for all assets beforehand and then tweak the processing order to sell to-be-sold assets first in order to release funds for to-be-bought assets. This can be automatically done by using CallSeqType.Auto.
Hint
All broadcastable arguments can be set per frame, series, row, column, or element.
Usage
- Buy 10 units each tick:
>>> close = pd.Series([1, 2, 3, 4, 5])
>>> pf = vbt.Portfolio.from_orders(close, 10)

>>> pf.assets()
0    10.0
1    20.0
2    30.0
3    40.0
4    40.0
dtype: float64
>>> pf.cash()
0    90.0
1    70.0
2    40.0
3     0.0
4     0.0
dtype: float64
- Reverse each position by first closing it:
>>> size = [1, 0, -1, 0, 1]
>>> pf = vbt.Portfolio.from_orders(close, size, size_type='targetpercent')

>>> pf.assets()
0    100.000000
1      0.000000
2    -66.666667
3      0.000000
4     26.666667
dtype: float64
>>> pf.cash()
0      0.000000
1    200.000000
2    400.000000
3    133.333333
4      0.000000
dtype: float64
- Equal-weighted portfolio as in simulate_nb() example (it's more compact but has less control over execution):
>>> np.random.seed(42)
>>> close = pd.DataFrame(np.random.uniform(1, 10, size=(5, 3)))
>>> size = pd.Series(np.full(5, 1/3))  # each column 33.3%
>>> size[1::2] = np.nan  # skip every second tick

>>> pf = vbt.Portfolio.from_orders(
...     close,  # acts both as reference and order price here
...     size,
...     size_type='targetpercent',
...     call_seq='auto',  # first sell then buy
...     group_by=True,  # one group
...     cash_sharing=True,  # assets share the same cash
...     fees=0.001, fixed_fees=1., slippage=0.001  # costs
... )

>>> pf.asset_value(group_by=False).vbt.plot()
from_random_signals class method
Portfolio.from_random_signals(
    close,
    n=None,
    prob=None,
    entry_prob=None,
    exit_prob=None,
    param_product=False,
    seed=None,
    run_kwargs=None,
    **kwargs
)
Simulate portfolio from random entry and exit signals.
Generates signals based either on the number of signals n or the probability of encountering a signal prob.
Based on Portfolio.from_signals().
Note
To generate random signals, the shape of close is used. Broadcasting with other arrays happens after the generation.
Usage
- Test multiple combinations of random entries and exits:
>>> close = pd.Series([1, 2, 3, 4, 5])
>>> pf = vbt.Portfolio.from_random_signals(close, n=[2, 1, 0], seed=42)
>>> pf.orders.count()
randnx_n
2    4
1    2
0    0
Name: count, dtype: int64
- Test the Cartesian product of entry and exit encounter probabilities:
>>> pf = vbt.Portfolio.from_random_signals(
...     close,
...     entry_prob=[0, 0.5, 1],
...     exit_prob=[0, 0.5, 1],
...     param_product=True,
...     seed=42)
>>> pf.orders.count()
rprobnx_entry_prob  rprobnx_exit_prob
0.0                 0.0                  0
                    0.5                  0
                    1.0                  0
0.5                 0.0                  1
                    0.5                  4
                    1.0                  3
1.0                 0.0                  1
                    0.5                  4
                    1.0                  5
Name: count, dtype: int64
from_signals class method
Portfolio.from_signals(
    close,
    entries=None,
    exits=None,
    short_entries=None,
    short_exits=None,
    signal_func_nb=no_signal_func_nb,
    signal_args=(),
    size=None,
    size_type=None,
    price=None,
    fees=None,
    fixed_fees=None,
    slippage=None,
    min_size=None,
    max_size=None,
    size_granularity=None,
    reject_prob=None,
    lock_cash=None,
    allow_partial=None,
    raise_reject=None,
    log=None,
    accumulate=None,
    upon_long_conflict=None,
    upon_short_conflict=None,
    upon_dir_conflict=None,
    upon_opposite_entry=None,
    direction=None,
    val_price=None,
    open=None,
    high=None,
    low=None,
    sl_stop=None,
    sl_trail=None,
    tp_stop=None,
    stop_entry_price=None,
    stop_exit_price=None,
    upon_stop_exit=None,
    upon_stop_update=None,
    adjust_sl_func_nb=no_adjust_sl_func_nb,
    adjust_sl_args=(),
    adjust_tp_func_nb=no_adjust_tp_func_nb,
    adjust_tp_args=(),
    use_stops=None,
    init_cash=None,
    cash_sharing=None,
    call_seq=None,
    ffill_val_price=None,
    update_value=None,
    max_orders=None,
    max_logs=None,
    init_temp_records=None,
    seed=None,
    group_by=None,
    broadcast_named_args=None,
    broadcast_kwargs=None,
    template_mapping=None,
    wrapper_kwargs=None,
    freq=None,
    attach_call_seq=None,
    engine=None,
    **kwargs
)
Simulate portfolio from entry and exit signals.
See simulate_from_signal_func_nb().
You have three options to provide signals:
-
entriesandexits: The direction of each pair of signals is taken fromdirectionargument. Best to use when the direction doesn't change throughout time.Uses dir_enex_signal_func_nb() as
signal_func_nb.Hint
entriesandexitscan be easily translated to direction-aware signals:- (True, True, 'longonly') -> True, True, False, False
- (True, True, 'shortonly') -> False, False, True, True
- (True, True, 'both') -> True, False, True, False
-
entries(acting as long),exits(acting as long),short_entries, andshort_exits: The direction is already built into the arrays. Best to use when the direction changes frequently (for example, if you have one indicator providing long signals and one providing short signals).Uses ls_enex_signal_func_nb() as
signal_func_nb. -
signal_func_nbandsignal_args: Custom signal function that returns direction-aware signals. Best to use when signals should be placed dynamically based on custom conditions.
Args
close:array_like- See Portfolio.from_orders().
entries:array_likeofbool-
Boolean array of entry signals. Defaults to True if all other signal arrays are not set, otherwise False. Will broadcast.
- If
short_entriesandshort_exitsare not set: Acts as a long signal ifdirectionisallorlongonly, otherwise short. - If
short_entriesorshort_exitsare set: Acts aslong_entries.
- If
exits:array_likeofbool-
Boolean array of exit signals. Defaults to False. Will broadcast.
- If
short_entriesandshort_exitsare not set: Acts as a short signal ifdirectionisallorlongonly, otherwise long. - If
short_entriesorshort_exitsare set: Acts aslong_exits.
- If
short_entries:array_likeofbool- Boolean array of short entry signals. Defaults to False. Will broadcast.
short_exits:array_likeofbool- Boolean array of short exit signals. Defaults to False. Will broadcast.
signal_func_nb:callable-
Function called to generate signals.
Should accept SignalContext and
*signal_args. Should return long entry signal, long exit signal, short entry signal, and short exit signal.Note
Stop signal has priority:
signal_func_nbis executed only if there is no stop signal. signal_args:tuple- Packed arguments passed to
signal_func_nb. Defaults to(). size:floatorarray_like-
Note
Negative size is not allowed. You should express direction using signals.
size_type:SizeTypeorarray_like-
Only
SizeType.Amount,SizeType.Value, andSizeType.Percentare supported. Other modes such as target percentage are not compatible with signals since their logic may contradict the direction of the signal.Note
SizeType.Percentdoes not support position reversal. Switch to a single direction or usevectorbt.portfolio.enums.OppositeEntryMode.Closeto close the position first.See warning in Portfolio.from_orders().
price:array_likeoffloat- See Portfolio.from_orders().
fees:floatorarray_like- See Portfolio.from_orders().
fixed_fees:floatorarray_like- See Portfolio.from_orders().
slippage:floatorarray_like- See Portfolio.from_orders().
min_size:floatorarray_like- See Portfolio.from_orders().
max_size:floatorarray_like-
Will be partially filled if exceeded. You might not be able to properly close the position if accumulation is enabled and
max_sizeis too low. size_granularity:floatorarray_like- See Portfolio.from_orders().
reject_prob:floatorarray_like- See Portfolio.from_orders().
lock_cash:boolorarray_like- See Portfolio.from_orders().
allow_partial:boolorarray_like- See Portfolio.from_orders().
raise_reject:boolorarray_like- See Portfolio.from_orders().
log:boolorarray_like- See Portfolio.from_orders().
accumulate:bool,AccumulationModeorarray_like-
See AccumulationMode. If True, becomes 'both'. If False, becomes 'disabled'. Will broadcast.
When enabled, Portfolio.from_signals() behaves similarly to Portfolio.from_orders().
upon_long_conflict:ConflictModeorarray_like- Conflict mode for long signals. See ConflictMode. Will broadcast.
upon_short_conflict:ConflictModeorarray_like- Conflict mode for short signals. See ConflictMode. Will broadcast.
upon_dir_conflict:DirectionConflictModeorarray_like- See DirectionConflictMode. Will broadcast.
upon_opposite_entry:OppositeEntryModeorarray_like- See OppositeEntryMode. Will broadcast.
direction:Directionorarray_like-
Takes only effect if
short_entriesandshort_exitsare not set. val_price:array_likeoffloat- See Portfolio.from_orders().
open:array_likeoffloat-
First asset price at each time step. Defaults to
np.nan, which gets replaced byclose. Will broadcast.Used solely for stop signals.
high:array_likeoffloat-
Highest asset price at each time step. Defaults to
np.nan, which gets replaced by the maximum out ofopenandclose. Will broadcast.Used solely for stop signals.
low:array_likeoffloat-
Lowest asset price at each time step. Defaults to
np.nan, which gets replaced by the minimum out ofopenandclose. Will broadcast.Used solely for stop signals.
sl_stop:array_likeoffloat-
Stop loss. Will broadcast.
A percentage below/above the acquisition price for long/short position. Note that 0.01 = 1%.
sl_trail:array_likeofbool- Whether
sl_stopshould be trailing. Will broadcast. tp_stop:array_likeoffloat-
Take profit. Will broadcast.
A percentage above/below the acquisition price for long/short position. Note that 0.01 = 1%.
stop_entry_price:StopEntryPriceorarray_like-
See StopEntryPrice. Will broadcast.
If provided on per-element basis, gets applied upon entry.
stop_exit_price:StopExitPriceorarray_like-
See StopExitPrice. Will broadcast.
If provided on per-element basis, gets applied upon exit.
upon_stop_exit:StopExitModeorarray_like-
See StopExitMode. Will broadcast.
If provided on per-element basis, gets applied upon exit.
upon_stop_update:StopUpdateModeorarray_like-
See StopUpdateMode. Will broadcast.
Only has effect if accumulation is enabled.
If provided on per-element basis, gets applied upon repeated entry.
adjust_sl_func_nb:callable-
Function to adjust stop loss. Defaults to no_adjust_sl_func_nb().
Called for each element before each row.
Should accept AdjustSLContext and
*adjust_sl_args. Should return a tuple of a new stop value and trailing flag. adjust_sl_args:tuple- Packed arguments passed to
adjust_sl_func_nb. Defaults to(). adjust_tp_func_nb:callable-
Function to adjust take profit. Defaults to no_adjust_tp_func_nb().
Called for each element before each row.
Should accept AdjustTPContext and
*adjust_tp_args. of the stop, and*adjust_tp_args. Should return a new stop value. adjust_tp_args:tuple- Packed arguments passed to
adjust_tp_func_nb. Defaults to(). use_stops:bool-
Whether to use stops. Defaults to None, which becomes True if any of the stops are not NaN or any of the adjustment functions are custom.
Disable this to make simulation a bit faster for simple use cases.
init_cash:InitCashMode,floatorarray_likeoffloat- See Portfolio.from_orders().
cash_sharing:bool- See Portfolio.from_orders().
call_seq:CallSeqTypeorarray_like- See Portfolio.from_orders().
ffill_val_price:bool- See Portfolio.from_orders().
update_value:bool- See Portfolio.from_orders().
max_orders:int- See Portfolio.from_orders().
max_logs:int- See Portfolio.from_orders().
seed:int- See Portfolio.from_orders().
group_by:any- See Portfolio.from_orders().
broadcast_named_args:dict-
Dictionary with named arguments to broadcast.
You can then pass argument names to the functions and this method will substitute them by their corresponding broadcasted objects.
broadcast_kwargs:dict- See Portfolio.from_orders().
template_mapping:mapping- Mapping to replace templates in arguments.
wrapper_kwargs:dict- See Portfolio.from_orders().
freq:any- See Portfolio.from_orders().
attach_call_seq:bool- See Portfolio.from_orders().
**kwargs- Keyword arguments passed to the
__init__method.
All broadcastable arguments will broadcast using broadcast() but keep original shape to utilize flexible indexing and to save memory.
For defaults, see portfolio in settings.
Note
Stop signal has priority - it's executed before other signals within the same bar. That is, if a stop signal is present, no other signals are generated and executed since there is a limit of one order per symbol and bar.
Hint
If you generated signals using close price, don't forget to shift your signals by one tick forward, for example, with signals.vbt.fshift(1). In general, make sure to use a price that comes after the signal.
Also see notes and hints for Portfolio.from_orders().
Usage
- By default, if all signal arrays are None,
entriesbecomes True, which opens a position at the very first tick and does nothing else:
>>> close = pd.Series([1, 2, 3, 4, 5])
>>> pf = vbt.Portfolio.from_signals(close, size=1)
>>> pf.asset_flow()
0    1.0
1    0.0
2    0.0
3    0.0
4    0.0
dtype: float64
- Entry opens long, exit closes long:
>>> pf = vbt.Portfolio.from_signals(
...     close,
...     entries=pd.Series([True, True, True, False, False]),
...     exits=pd.Series([False, False, True, True, True]),
...     size=1,
...     direction='longonly'
... )
>>> pf.asset_flow()
0    1.0
1    0.0
2    0.0
3   -1.0
4    0.0
dtype: float64

>>> # Using direction-aware arrays instead of `direction`
>>> pf = vbt.Portfolio.from_signals(
...     close,
...     entries=pd.Series([True, True, True, False, False]),  # long_entries
...     exits=pd.Series([False, False, True, True, True]),  # long_exits
...     short_entries=False,
...     short_exits=False,
...     size=1
... )
>>> pf.asset_flow()
0    1.0
1    0.0
2    0.0
3   -1.0
4    0.0
dtype: float64
Notice how both short_entries and short_exits are provided as constants - as any other broadcastable argument, they are treated as arrays where each element is False.
- Entry opens short, exit closes short:
>>> pf = vbt.Portfolio.from_signals(
...     close,
...     entries=pd.Series([True, True, True, False, False]),
...     exits=pd.Series([False, False, True, True, True]),
...     size=1,
...     direction='shortonly'
... )
>>> pf.asset_flow()
0   -1.0
1    0.0
2    0.0
3    1.0
4    0.0
dtype: float64

>>> # Using direction-aware arrays instead of `direction`
>>> pf = vbt.Portfolio.from_signals(
...     close,
...     entries=False,  # long_entries
...     exits=False,  # long_exits
...     short_entries=pd.Series([True, True, True, False, False]),
...     short_exits=pd.Series([False, False, True, True, True]),
...     size=1
... )
>>> pf.asset_flow()
0   -1.0
1    0.0
2    0.0
3    1.0
4    0.0
dtype: float64
- Entry opens long and closes short, exit closes long and opens short:
>>> pf = vbt.Portfolio.from_signals(
...     close,
...     entries=pd.Series([True, True, True, False, False]),
...     exits=pd.Series([False, False, True, True, True]),
...     size=1,
...     direction='both'
... )
>>> pf.asset_flow()
0    1.0
1    0.0
2    0.0
3   -2.0
4    0.0
dtype: float64

>>> # Using direction-aware arrays instead of `direction`
>>> pf = vbt.Portfolio.from_signals(
...     close,
...     entries=pd.Series([True, True, True, False, False]),  # long_entries
...     exits=False,  # long_exits
...     short_entries=pd.Series([False, False, True, True, True]),
...     short_exits=False,
...     size=1
... )
>>> pf.asset_flow()
0    1.0
1    0.0
2    0.0
3   -2.0
4    0.0
dtype: float64
- More complex signal combinations are best expressed using direction-aware arrays. For example, ignore opposite signals as long as the current position is open:
>>> pf = vbt.Portfolio.from_signals(
...     close,
...     entries      =pd.Series([True, False, False, False, False]),  # long_entries
...     exits        =pd.Series([False, False, True, False, False]),  # long_exits
...     short_entries=pd.Series([False, True, False, True, False]),
...     short_exits  =pd.Series([False, False, False, False, True]),
...     size=1,
...     upon_opposite_entry='ignore'
... )
>>> pf.asset_flow()
0    1.0
1    0.0
2   -1.0
3   -1.0
4    1.0
dtype: float64
- First opposite signal closes the position, second one opens a new position:
>>> pf = vbt.Portfolio.from_signals(
...     close,
...     entries=pd.Series([True, True, True, False, False]),
...     exits=pd.Series([False, False, True, True, True]),
...     size=1,
...     direction='both',
...     upon_opposite_entry='close'
... )
>>> pf.asset_flow()
0    1.0
1    0.0
2    0.0
3   -1.0
4   -1.0
dtype: float64
- If both long entry and exit signals are True (a signal conflict), choose exit:
>>> pf = vbt.Portfolio.from_signals(
...     close,
...     entries=pd.Series([True, True, True, False, False]),
...     exits=pd.Series([False, False, True, True, True]),
...     size=1.,
...     direction='longonly',
...     upon_long_conflict='exit')
>>> pf.asset_flow()
0    1.0
1    0.0
2   -1.0
3    0.0
4    0.0
dtype: float64
- If both long entry and short entry signal are True (a direction conflict), choose short:
>>> pf = vbt.Portfolio.from_signals(
...     close,
...     entries=pd.Series([True, True, True, False, False]),
...     exits=pd.Series([False, False, True, True, True]),
...     size=1.,
...     direction='both',
...     upon_dir_conflict='short')
>>> pf.asset_flow()
0    1.0
1    0.0
2   -2.0
3    0.0
4    0.0
dtype: float64
Note
Remember that when direction is set to 'both', entries become long_entries and exits become short_entries, so this becomes a conflict of directions rather than signals.
- If there are both signal and direction conflicts:
>>> pf = vbt.Portfolio.from_signals(
...     close,
...     entries=True,  # long_entries
...     exits=True,  # long_exits
...     short_entries=True,
...     short_exits=True,
...     size=1,
...     upon_long_conflict='entry',
...     upon_short_conflict='entry',
...     upon_dir_conflict='short'
... )
>>> pf.asset_flow()
0   -1.0
1    0.0
2    0.0
3    0.0
4    0.0
dtype: float64
- Turn on accumulation of signals. Entry means long order, exit means short order (acts similar to
from_orders):
>>> pf = vbt.Portfolio.from_signals(
...     close,
...     entries=pd.Series([True, True, True, False, False]),
...     exits=pd.Series([False, False, True, True, True]),
...     size=1.,
...     direction='both',
...     accumulate=True)
>>> pf.asset_flow()
0    1.0
1    1.0
2    0.0
3   -1.0
4   -1.0
dtype: float64
- Allow increasing a position (of any direction), deny decreasing a position:
>>> pf = vbt.Portfolio.from_signals(
...     close,
...     entries=pd.Series([True, True, True, False, False]),
...     exits=pd.Series([False, False, True, True, True]),
...     size=1.,
...     direction='both',
...     accumulate='addonly')
>>> pf.asset_flow()
0    1.0  << open a long position
1    1.0  << add to the position
2    0.0
3   -3.0  << close and open a short position
4   -1.0  << add to the position
dtype: float64
- Testing multiple parameters (via broadcasting):
>>> pf = vbt.Portfolio.from_signals(
...     close,
...     entries=pd.Series([True, True, True, False, False]),
...     exits=pd.Series([False, False, True, True, True]),
...     direction=[list(Direction)],
...     broadcast_kwargs=dict(columns_from=Direction._fields))
>>> pf.asset_flow()
    Long  Short    All
0  100.0 -100.0  100.0
1    0.0    0.0    0.0
2    0.0    0.0    0.0
3 -100.0   50.0 -200.0
4    0.0    0.0    0.0
- Set risk/reward ratio by passing trailing stop loss and take profit thresholds:
>>> close = pd.Series([10, 11, 12, 11, 10, 9])
>>> entries = pd.Series([True, False, False, False, False, False])
>>> exits = pd.Series([False, False, False, False, False, True])
>>> pf = vbt.Portfolio.from_signals(
...     close, entries, exits,
...     sl_stop=0.1, sl_trail=True, tp_stop=0.2)  # take profit hit
>>> pf.asset_flow()
0    10.0
1     0.0
2   -10.0
3     0.0
4     0.0
5     0.0
dtype: float64

>>> pf = vbt.Portfolio.from_signals(
...     close, entries, exits,
...     sl_stop=0.1, sl_trail=True, tp_stop=0.3)  # stop loss hit
>>> pf.asset_flow()
0    10.0
1     0.0
2     0.0
3     0.0
4   -10.0
5     0.0
dtype: float64

>>> pf = vbt.Portfolio.from_signals(
...     close, entries, exits,
...     sl_stop=np.inf, sl_trail=True, tp_stop=np.inf)  # nothing hit, exit as usual
>>> pf.asset_flow()
0    10.0
1     0.0
2     0.0
3     0.0
4     0.0
5   -10.0
dtype: float64
Note
When the stop price is hit, the stop signal invalidates any other signal defined for this bar. Thus, make sure that your signaling logic happens at the very end of the bar (for example, by using the closing price), otherwise you may expose yourself to a look-ahead bias.
See StopExitPrice for more details.
- We can implement our own stop loss or take profit, or adjust the existing one at each time step. Let's implement stepped stop-loss:
>>> @njit
... def adjust_sl_func_nb(c):
...     current_profit = (c.val_price_now - c.init_price) / c.init_price
...     if current_profit >= 0.40:
...         return 0.25, True
...     elif current_profit >= 0.25:
...         return 0.15, True
...     elif current_profit >= 0.20:
...         return 0.07, True
...     return c.curr_stop, c.curr_trail

>>> close = pd.Series([10, 11, 12, 11, 10])
>>> pf = vbt.Portfolio.from_signals(close, adjust_sl_func_nb=adjust_sl_func_nb)
>>> pf.asset_flow()
0    10.0
1     0.0
2     0.0
3   -10.0  # 7% from 12 hit
4    11.0
dtype: float64
- Sometimes there is a need to provide or transform signals dynamically. For this, we can implement a custom signal function
signal_func_nb. For example, let's implement a signal function that takes two numerical arrays - long and short one - and transforms them into 4 direction-aware boolean arrays that vectorbt understands:
>>> @njit
... def signal_func_nb(c, long_num_arr, short_num_arr):
...     long_num = nb.get_elem_nb(c, long_num_arr)
...     short_num = nb.get_elem_nb(c, short_num_arr)
...     is_long_entry = long_num > 0
...     is_long_exit = long_num < 0
...     is_short_entry = short_num > 0
...     is_short_exit = short_num < 0
...     return is_long_entry, is_long_exit, is_short_entry, is_short_exit

>>> pf = vbt.Portfolio.from_signals(
...     pd.Series([1, 2, 3, 4, 5]),
...     signal_func_nb=signal_func_nb,
...     signal_args=(vbt.Rep('long_num_arr'), vbt.Rep('short_num_arr')),
...     broadcast_named_args=dict(
...         long_num_arr=pd.Series([1, 0, -1, 0, 0]),
...         short_num_arr=pd.Series([0, 1, 0, 1, -1])
...     ),
...     size=1,
...     upon_opposite_entry='ignore'
... )
>>> pf.asset_flow()
0    1.0
1    0.0
2   -1.0
3   -1.0
4    1.0
dtype: float64
Passing both arrays as broadcast_named_args broadcasts them internally as any other array, so we don't have to worry about their dimensions every time we change our data.
get_drawdowns method
Portfolio.get_drawdowns(
    group_by=None,
    wrap_kwargs=None,
    wrapper_kwargs=None,
    **kwargs
)
Get drawdown records from Portfolio.value().
See Drawdowns.
get_entry_trades method
Portfolio.get_entry_trades(
    group_by=None,
    **kwargs
)
Get entry trade records.
See EntryTrades.
get_exit_trades method
Portfolio.get_exit_trades(
    group_by=None,
    **kwargs
)
Get exit trade records.
See ExitTrades.
get_filled_close method
Portfolio.get_filled_close(
    wrap_kwargs=None
)
Forward-backward-fill NaN values in Portfolio.close
get_init_cash method
Portfolio.get_init_cash(
    group_by=None,
    wrap_kwargs=None,
    engine=None
)
Initial amount of cash per column/group with default arguments.
Note
If the initial cash balance was found automatically and no own cash is used throughout the simulation (for example, when shorting), it will be set to 1 instead of 0 to enable smooth calculation of returns.
get_logs method
Portfolio.get_logs(
    group_by=None,
    **kwargs
)
Get log records.
See Logs.
get_orders method
Portfolio.get_orders(
    group_by=None,
    **kwargs
)
Get order records.
See Orders.
get_positions method
Portfolio.get_positions(
    group_by=None,
    **kwargs
)
Get position records.
See Positions.
get_qs method
Portfolio.get_qs(
    group_by=None,
    benchmark_rets=None,
    freq=None,
    year_freq=None,
    use_asset_returns=False,
    **kwargs
)
Get quantstats adapter of type QSAdapter.
**kwargs are passed to the adapter constructor.
get_returns_acc method
Portfolio.get_returns_acc(
    group_by=None,
    benchmark_rets=None,
    freq=None,
    year_freq=None,
    use_asset_returns=False,
    defaults=None,
    **kwargs
)
Get returns accessor of type ReturnsAccessor.
Hint
You can find most methods of this accessor as (cacheable) attributes of this portfolio.
get_trades method
Portfolio.get_trades(
    group_by=None,
    **kwargs
)
Get trade/position records depending upon Portfolio.trades_type.
gross_exposure method
Portfolio.gross_exposure(
    direction='both',
    group_by=None,
    wrap_kwargs=None,
    engine=None
)
Get gross exposure.
Gross exposure is the sum of absolute position values divided by portfolio value. For grouped portfolios with mixed long/short positions, per-column absolute values are summed before dividing by group portfolio value.
indexing_func method
Portfolio.indexing_func(
    pd_indexing_func,
    **kwargs
)
Perform indexing on Portfolio.
information_ratio method
Portfolio.information_ratio(
    *,
    group_by=None,
    benchmark_rets=None,
    freq=None,
    year_freq=None,
    use_asset_returns=False,
    **kwargs
)
See ReturnsAccessor.information_ratio().
init_cash method
Portfolio.get_init_cash() with default arguments.
log_records property
A structured NumPy array of log records.
logs method
Portfolio.get_logs() with default arguments.
max_drawdown method
Portfolio.max_drawdown(
    *,
    group_by=None,
    benchmark_rets=None,
    freq=None,
    year_freq=None,
    use_asset_returns=False,
    **kwargs
)
See ReturnsAccessor.max_drawdown().
metrics class variable
Metrics supported by Portfolio.
Config({
    "start": {
        "title": "Start",
        "calc_func": "<function Portfolio.<lambda> at 0x7ff0fc712a20>",
        "agg_func": null,
        "tags": "wrapper"
    },
    "end": {
        "title": "End",
        "calc_func": "<function Portfolio.<lambda> at 0x7ff0fc712ac0>",
        "agg_func": null,
        "tags": "wrapper"
    },
    "period": {
        "title": "Period",
        "calc_func": "<function Portfolio.<lambda> at 0x7ff0fc712b60>",
        "apply_to_timedelta": true,
        "agg_func": null,
        "tags": "wrapper"
    },
    "start_value": {
        "title": "Start Value",
        "calc_func": "get_init_cash",
        "tags": "portfolio"
    },
    "end_value": {
        "title": "End Value",
        "calc_func": "final_value",
        "tags": "portfolio"
    },
    "total_return": {
        "title": "Total Return [%]",
        "calc_func": "total_return",
        "post_calc_func": "<function Portfolio.<lambda> at 0x7ff0fc712c00>",
        "tags": "portfolio"
    },
    "benchmark_return": {
        "title": "Benchmark Return [%]",
        "calc_func": "benchmark_rets.vbt.returns.total",
        "post_calc_func": "<function Portfolio.<lambda> at 0x7ff0fc712ca0>",
        "tags": "portfolio"
    },
    "max_gross_exposure": {
        "title": "Max Gross Exposure [%]",
        "calc_func": "gross_exposure.vbt.max",
        "post_calc_func": "<function Portfolio.<lambda> at 0x7ff0fc712d40>",
        "tags": "portfolio"
    },
    "total_fees_paid": {
        "title": "Total Fees Paid",
        "calc_func": "orders.fees.sum",
        "tags": [
            "portfolio",
            "orders"
        ]
    },
    "max_dd": {
        "title": "Max Drawdown [%]",
        "calc_func": "drawdowns.max_drawdown",
        "post_calc_func": "<function Portfolio.<lambda> at 0x7ff0fc712de0>",
        "tags": [
            "portfolio",
            "drawdowns"
        ]
    },
    "max_dd_duration": {
        "title": "Max Drawdown Duration",
        "calc_func": "drawdowns.max_duration",
        "fill_wrap_kwargs": true,
        "tags": [
            "portfolio",
            "drawdowns",
            "duration"
        ]
    },
    "total_trades": {
        "title": "Total Trades",
        "calc_func": "trades.count",
        "incl_open": true,
        "tags": [
            "portfolio",
            "trades"
        ]
    },
    "total_closed_trades": {
        "title": "Total Closed Trades",
        "calc_func": "trades.closed.count",
        "tags": [
            "portfolio",
            "trades",
            "closed"
        ]
    },
    "total_open_trades": {
        "title": "Total Open Trades",
        "calc_func": "trades.open.count",
        "incl_open": true,
        "tags": [
            "portfolio",
            "trades",
            "open"
        ]
    },
    "open_trade_pnl": {
        "title": "Open Trade PnL",
        "calc_func": "trades.open.pnl.sum",
        "incl_open": true,
        "tags": [
            "portfolio",
            "trades",
            "open"
        ]
    },
    "win_rate": {
        "title": "Win Rate [%]",
        "calc_func": "trades.win_rate",
        "post_calc_func": "<function Portfolio.<lambda> at 0x7ff0fc712e80>",
        "tags": "RepEval(expression=\"['portfolio', 'trades', *incl_open_tags]\", mapping={})"
    },
    "best_trade": {
        "title": "Best Trade [%]",
        "calc_func": "trades.returns.max",
        "post_calc_func": "<function Portfolio.<lambda> at 0x7ff0fc712f20>",
        "tags": "RepEval(expression=\"['portfolio', 'trades', *incl_open_tags]\", mapping={})"
    },
    "worst_trade": {
        "title": "Worst Trade [%]",
        "calc_func": "trades.returns.min",
        "post_calc_func": "<function Portfolio.<lambda> at 0x7ff0fc712fc0>",
        "tags": "RepEval(expression=\"['portfolio', 'trades', *incl_open_tags]\", mapping={})"
    },
    "avg_winning_trade": {
        "title": "Avg Winning Trade [%]",
        "calc_func": "trades.winning.returns.mean",
        "post_calc_func": "<function Portfolio.<lambda> at 0x7ff0fc713060>",
        "tags": "RepEval(expression=\"['portfolio', 'trades', *incl_open_tags, 'winning']\", mapping={})"
    },
    "avg_losing_trade": {
        "title": "Avg Losing Trade [%]",
        "calc_func": "trades.losing.returns.mean",
        "post_calc_func": "<function Portfolio.<lambda> at 0x7ff0fc713100>",
        "tags": "RepEval(expression=\"['portfolio', 'trades', *incl_open_tags, 'losing']\", mapping={})"
    },
    "avg_winning_trade_duration": {
        "title": "Avg Winning Trade Duration",
        "calc_func": "trades.winning.duration.mean",
        "apply_to_timedelta": true,
        "tags": "RepEval(expression=\"['portfolio', 'trades', *incl_open_tags, 'winning', 'duration']\", mapping={})"
    },
    "avg_losing_trade_duration": {
        "title": "Avg Losing Trade Duration",
        "calc_func": "trades.losing.duration.mean",
        "apply_to_timedelta": true,
        "tags": "RepEval(expression=\"['portfolio', 'trades', *incl_open_tags, 'losing', 'duration']\", mapping={})"
    },
    "profit_factor": {
        "title": "Profit Factor",
        "calc_func": "trades.profit_factor",
        "tags": "RepEval(expression=\"['portfolio', 'trades', *incl_open_tags]\", mapping={})"
    },
    "expectancy": {
        "title": "Expectancy",
        "calc_func": "trades.expectancy",
        "tags": "RepEval(expression=\"['portfolio', 'trades', *incl_open_tags]\", mapping={})"
    },
    "sharpe_ratio": {
        "title": "Sharpe Ratio",
        "calc_func": "returns_acc.sharpe_ratio",
        "check_has_freq": true,
        "check_has_year_freq": true,
        "tags": [
            "portfolio",
            "returns"
        ]
    },
    "calmar_ratio": {
        "title": "Calmar Ratio",
        "calc_func": "returns_acc.calmar_ratio",
        "check_has_freq": true,
        "check_has_year_freq": true,
        "tags": [
            "portfolio",
            "returns"
        ]
    },
    "omega_ratio": {
        "title": "Omega Ratio",
        "calc_func": "returns_acc.omega_ratio",
        "check_has_freq": true,
        "check_has_year_freq": true,
        "tags": [
            "portfolio",
            "returns"
        ]
    },
    "sortino_ratio": {
        "title": "Sortino Ratio",
        "calc_func": "returns_acc.sortino_ratio",
        "check_has_freq": true,
        "check_has_year_freq": true,
        "tags": [
            "portfolio",
            "returns"
        ]
    }
})
Returns Portfolio._metrics, which gets (deep) copied upon creation of each instance. Thus, changing this config won't affect the class.
To change metrics, you can either change the config in-place, override this property, or overwrite the instance variable Portfolio._metrics.
net_exposure method
Portfolio.net_exposure(
    group_by=None,
    wrap_kwargs=None
)
Get net exposure.
omega_ratio method
Portfolio.omega_ratio(
    *,
    group_by=None,
    benchmark_rets=None,
    freq=None,
    year_freq=None,
    use_asset_returns=False,
    **kwargs
)
See ReturnsAccessor.omega_ratio().
order_records property
A structured NumPy array of order records.
orders method
Portfolio.get_orders() with default arguments.
plot method
PlotsBuilderMixin.plots(
    subplots=None,
    tags=None,
    column=None,
    group_by=None,
    silence_warnings=None,
    template_mapping=None,
    settings=None,
    filters=None,
    subplot_settings=None,
    show_titles=None,
    hide_id_labels=None,
    group_id_labels=None,
    make_subplots_kwargs=None,
    **layout_kwargs
)
See PlotsBuilderMixin.plots().
plot_asset_flow method
Portfolio.plot_asset_flow(
    column=None,
    direction='both',
    xref='x',
    yref='y',
    hline_shape_kwargs=None,
    **kwargs
)
Plot one column of asset flow.
Args
column:str- Name of the column to plot.
direction:Direction- See Direction.
xref:str- X coordinate axis.
yref:str- Y coordinate axis.
hline_shape_kwargs:dict- Keyword arguments passed to
plotly.graph_objects.Figure.add_shapefor zeroline. **kwargs- Keyword arguments passed to GenericAccessor.plot().
plot_asset_value method
Portfolio.plot_asset_value(
    column=None,
    group_by=None,
    direction='both',
    xref='x',
    yref='y',
    hline_shape_kwargs=None,
    **kwargs
)
Plot one column/group of asset value.
Args
column:str- Name of the column/group to plot.
group_by:any- Group or ungroup columns. See ColumnGrouper.
direction:Direction- See Direction.
xref:str- X coordinate axis.
yref:str- Y coordinate axis.
hline_shape_kwargs:dict- Keyword arguments passed to
plotly.graph_objects.Figure.add_shapefor zeroline. **kwargs- Keyword arguments passed to GenericSRAccessor.plot_against().
plot_assets method
Portfolio.plot_assets(
    column=None,
    direction='both',
    xref='x',
    yref='y',
    hline_shape_kwargs=None,
    **kwargs
)
Plot one column of assets.
Args
column:str- Name of the column to plot.
direction:Direction- See Direction.
xref:str- X coordinate axis.
yref:str- Y coordinate axis.
hline_shape_kwargs:dict- Keyword arguments passed to
plotly.graph_objects.Figure.add_shapefor zeroline. **kwargs- Keyword arguments passed to GenericSRAccessor.plot_against().
plot_cash method
Portfolio.plot_cash(
    column=None,
    group_by=None,
    free=False,
    xref='x',
    yref='y',
    hline_shape_kwargs=None,
    **kwargs
)
Plot one column/group of cash balance.
Args
column:str- Name of the column/group to plot.
group_by:any- Group or ungroup columns. See ColumnGrouper.
free:bool- Whether to plot the flow of the free cash.
xref:str- X coordinate axis.
yref:str- Y coordinate axis.
hline_shape_kwargs:dict- Keyword arguments passed to
plotly.graph_objects.Figure.add_shapefor zeroline. **kwargs- Keyword arguments passed to GenericSRAccessor.plot_against().
plot_cash_flow method
Portfolio.plot_cash_flow(
    column=None,
    group_by=None,
    free=False,
    xref='x',
    yref='y',
    hline_shape_kwargs=None,
    **kwargs
)
Plot one column/group of cash flow.
Args
column:str- Name of the column/group to plot.
group_by:any- Group or ungroup columns. See ColumnGrouper.
free:bool- Whether to plot the flow of the free cash.
xref:str- X coordinate axis.
yref:str- Y coordinate axis.
hline_shape_kwargs:dict- Keyword arguments passed to
plotly.graph_objects.Figure.add_shapefor zeroline. **kwargs- Keyword arguments passed to GenericAccessor.plot().
plot_cum_returns method
Portfolio.plot_cum_returns(
    column=None,
    group_by=None,
    benchmark_rets=None,
    use_asset_returns=False,
    **kwargs
)
Plot one column/group of cumulative returns.
Args
column:str- Name of the column/group to plot.
group_by:any- Group or ungroup columns. See ColumnGrouper.
benchmark_rets:array_like-
Benchmark returns.
If None, will use Portfolio.benchmark_returns().
use_asset_returns:bool- Whether to plot asset returns.
**kwargs- Keyword arguments passed to ReturnsSRAccessor.plot_cumulative().
plot_drawdowns method
Portfolio.plot_drawdowns(
    column=None,
    group_by=None,
    **kwargs
)
Plot one column/group of drawdowns.
Args
column:str- Name of the column/group to plot.
group_by:any- Group or ungroup columns. See ColumnGrouper.
**kwargs- Keyword arguments passed to Drawdowns.plot().
plot_gross_exposure method
Portfolio.plot_gross_exposure(
    column=None,
    group_by=None,
    direction='both',
    xref='x',
    yref='y',
    hline_shape_kwargs=None,
    **kwargs
)
Plot one column/group of gross exposure.
Args
column:str- Name of the column/group to plot.
group_by:any- Group or ungroup columns. See ColumnGrouper.
direction:Direction- See Direction.
xref:str- X coordinate axis.
yref:str- Y coordinate axis.
hline_shape_kwargs:dict- Keyword arguments passed to
plotly.graph_objects.Figure.add_shapefor zeroline. **kwargs- Keyword arguments passed to GenericSRAccessor.plot_against().
plot_net_exposure method
Portfolio.plot_net_exposure(
    column=None,
    group_by=None,
    xref='x',
    yref='y',
    hline_shape_kwargs=None,
    **kwargs
)
Plot one column/group of net exposure.
Args
column:str- Name of the column/group to plot.
group_by:any- Group or ungroup columns. See ColumnGrouper.
xref:str- X coordinate axis.
yref:str- Y coordinate axis.
hline_shape_kwargs:dict- Keyword arguments passed to
plotly.graph_objects.Figure.add_shapefor zeroline. **kwargs- Keyword arguments passed to GenericSRAccessor.plot_against().
plot_orders method
Portfolio.plot_orders(
    column=None,
    **kwargs
)
Plot one column/group of orders.
plot_position_pnl method
Portfolio.plot_position_pnl(
    column=None,
    **kwargs
)
Plot one column/group of position PnL.
plot_positions method
Portfolio.plot_positions(
    column=None,
    **kwargs
)
Plot one column/group of positions.
plot_trade_pnl method
Portfolio.plot_trade_pnl(
    column=None,
    **kwargs
)
Plot one column/group of trade PnL.
plot_trades method
Portfolio.plot_trades(
    column=None,
    **kwargs
)
Plot one column/group of trades.
plot_underwater method
Portfolio.plot_underwater(
    column=None,
    group_by=None,
    xref='x',
    yref='y',
    hline_shape_kwargs=None,
    **kwargs
)
Plot one column/group of underwater.
Args
column:str- Name of the column/group to plot.
group_by:any- Group or ungroup columns. See ColumnGrouper.
xref:str- X coordinate axis.
yref:str- Y coordinate axis.
hline_shape_kwargs:dict- Keyword arguments passed to
plotly.graph_objects.Figure.add_shapefor zeroline. **kwargs- Keyword arguments passed to GenericAccessor.plot().
plot_value method
Portfolio.plot_value(
    column=None,
    group_by=None,
    xref='x',
    yref='y',
    hline_shape_kwargs=None,
    **kwargs
)
Plot one column/group of value.
Args
column:str- Name of the column/group to plot.
group_by:any- Group or ungroup columns. See ColumnGrouper.
free:bool- Whether to plot free cash flow.
xref:str- X coordinate axis.
yref:str- Y coordinate axis.
hline_shape_kwargs:dict- Keyword arguments passed to
plotly.graph_objects.Figure.add_shapefor zeroline. **kwargs- Keyword arguments passed to GenericSRAccessor.plot_against().
plots_defaults property
Defaults for PlotsBuilderMixin.plots().
Merges PlotsBuilderMixin.plots_defaults and portfolio.plots from settings.
position_coverage method
Portfolio.position_coverage(
    direction='both',
    group_by=None,
    wrap_kwargs=None
)
Get position coverage per column/group.
position_mask method
Portfolio.position_mask(
    direction='both',
    group_by=None,
    wrap_kwargs=None
)
Get position mask per column/group.
An element is True if the asset is in the market at this tick.
positions method
Portfolio.get_positions() with default arguments.
post_resolve_attr method
Portfolio.post_resolve_attr(
    attr,
    out,
    final_kwargs=None
)
Post-process an object after resolution.
Uses the following keys:
incl_open: Whether to include open trades/positions when resolving an argument that is an instance of Trades.
pre_resolve_attr method
Portfolio.pre_resolve_attr(
    attr,
    final_kwargs=None
)
Pre-process an attribute before resolution.
Uses the following keys:
use_asset_returns: Whether to use Portfolio.asset_returns() when resolvingreturnsargument.trades_type: Which trade type to use when resolvingtradesargument.
qs method
Portfolio.get_qs() with default arguments.
regroup method
Portfolio.regroup(
    group_by,
    **kwargs
)
Regroup this object.
See Wrapping.regroup().
Note
All cached objects will be lost.
returns method
Portfolio.returns(
    group_by=None,
    in_sim_order=False,
    wrap_kwargs=None,
    engine=None
)
Get return series per column/group based on portfolio value.
returns_acc property
Portfolio.get_returns_acc() with default arguments.
returns_stats method
Portfolio.returns_stats(
    group_by=None,
    benchmark_rets=None,
    freq=None,
    year_freq=None,
    use_asset_returns=False,
    defaults=None,
    **kwargs
)
Compute various statistics on returns of this portfolio.
See Portfolio.returns_acc and ReturnsAccessor.metrics.
kwargs will be passed to StatsBuilderMixin.stats() method. If benchmark_rets is not set, uses Portfolio.benchmark_returns().
sharpe_ratio method
Portfolio.sharpe_ratio(
    *,
    group_by=None,
    benchmark_rets=None,
    freq=None,
    year_freq=None,
    use_asset_returns=False,
    **kwargs
)
See ReturnsAccessor.sharpe_ratio().
sortino_ratio method
Portfolio.sortino_ratio(
    *,
    group_by=None,
    benchmark_rets=None,
    freq=None,
    year_freq=None,
    use_asset_returns=False,
    **kwargs
)
See ReturnsAccessor.sortino_ratio().
stats_defaults property
Defaults for StatsBuilderMixin.stats().
Merges StatsBuilderMixin.stats_defaults and portfolio.stats from settings.
subplots class variable
Subplots supported by Portfolio.
Config({
    "orders": {
        "title": "Orders",
        "yaxis_kwargs": {
            "title": "Price"
        },
        "check_is_not_grouped": true,
        "plot_func": "orders.plot",
        "tags": [
            "portfolio",
            "orders"
        ]
    },
    "trades": {
        "title": "Trades",
        "yaxis_kwargs": {
            "title": "Price"
        },
        "check_is_not_grouped": true,
        "plot_func": "trades.plot",
        "tags": [
            "portfolio",
            "trades"
        ]
    },
    "trade_pnl": {
        "title": "Trade PnL",
        "yaxis_kwargs": {
            "title": "Trade PnL"
        },
        "check_is_not_grouped": true,
        "plot_func": "trades.plot_pnl",
        "tags": [
            "portfolio",
            "trades"
        ]
    },
    "asset_flow": {
        "title": "Asset Flow",
        "yaxis_kwargs": {
            "title": "Asset flow"
        },
        "check_is_not_grouped": true,
        "plot_func": "plot_asset_flow",
        "pass_add_trace_kwargs": true,
        "tags": [
            "portfolio",
            "assets"
        ]
    },
    "cash_flow": {
        "title": "Cash Flow",
        "yaxis_kwargs": {
            "title": "Cash flow"
        },
        "plot_func": "plot_cash_flow",
        "pass_add_trace_kwargs": true,
        "tags": [
            "portfolio",
            "cash"
        ]
    },
    "assets": {
        "title": "Assets",
        "yaxis_kwargs": {
            "title": "Assets"
        },
        "check_is_not_grouped": true,
        "plot_func": "plot_assets",
        "pass_add_trace_kwargs": true,
        "tags": [
            "portfolio",
            "assets"
        ]
    },
    "cash": {
        "title": "Cash",
        "yaxis_kwargs": {
            "title": "Cash"
        },
        "plot_func": "plot_cash",
        "pass_add_trace_kwargs": true,
        "tags": [
            "portfolio",
            "cash"
        ]
    },
    "asset_value": {
        "title": "Asset Value",
        "yaxis_kwargs": {
            "title": "Asset value"
        },
        "plot_func": "plot_asset_value",
        "pass_add_trace_kwargs": true,
        "tags": [
            "portfolio",
            "assets",
            "value"
        ]
    },
    "value": {
        "title": "Value",
        "yaxis_kwargs": {
            "title": "Value"
        },
        "plot_func": "plot_value",
        "pass_add_trace_kwargs": true,
        "tags": [
            "portfolio",
            "value"
        ]
    },
    "cum_returns": {
        "title": "Cumulative Returns",
        "yaxis_kwargs": {
            "title": "Cumulative returns"
        },
        "plot_func": "plot_cum_returns",
        "pass_hline_shape_kwargs": true,
        "pass_add_trace_kwargs": true,
        "pass_xref": true,
        "pass_yref": true,
        "tags": [
            "portfolio",
            "returns"
        ]
    },
    "drawdowns": {
        "title": "Drawdowns",
        "yaxis_kwargs": {
            "title": "Value"
        },
        "plot_func": "plot_drawdowns",
        "pass_add_trace_kwargs": true,
        "pass_xref": true,
        "pass_yref": true,
        "tags": [
            "portfolio",
            "value",
            "drawdowns"
        ]
    },
    "underwater": {
        "title": "Underwater",
        "yaxis_kwargs": {
            "title": "Drawdown"
        },
        "plot_func": "plot_underwater",
        "pass_add_trace_kwargs": true,
        "tags": [
            "portfolio",
            "value",
            "drawdowns"
        ]
    },
    "gross_exposure": {
        "title": "Gross Exposure",
        "yaxis_kwargs": {
            "title": "Gross exposure"
        },
        "plot_func": "plot_gross_exposure",
        "pass_add_trace_kwargs": true,
        "tags": [
            "portfolio",
            "exposure"
        ]
    },
    "net_exposure": {
        "title": "Net Exposure",
        "yaxis_kwargs": {
            "title": "Net exposure"
        },
        "plot_func": "plot_net_exposure",
        "pass_add_trace_kwargs": true,
        "tags": [
            "portfolio",
            "exposure"
        ]
    }
})
Returns Portfolio._subplots, which gets (deep) copied upon creation of each instance. Thus, changing this config won't affect the class.
To change subplots, you can either change the config in-place, override this property, or overwrite the instance variable Portfolio._subplots.
tail_ratio method
Portfolio.tail_ratio(
    *,
    group_by=None,
    benchmark_rets=None,
    freq=None,
    year_freq=None,
    use_asset_returns=False,
    **kwargs
)
See ReturnsAccessor.tail_ratio().
total_benchmark_return method
Portfolio.total_benchmark_return(
    group_by=None,
    wrap_kwargs=None,
    engine=None
)
Get total benchmark return.
total_profit method
Portfolio.total_profit(
    group_by=None,
    wrap_kwargs=None,
    engine=None
)
Get total profit per column/group.
Calculated directly from order records (fast).
total_return method
Portfolio.total_return(
    group_by=None,
    wrap_kwargs=None,
    engine=None
)
Get total profit per column/group.
trades method
Portfolio.get_trades() with default arguments.
trades_type property
Default Trades to use across Portfolio.
up_capture method
Portfolio.up_capture(
    *,
    group_by=None,
    benchmark_rets=None,
    freq=None,
    year_freq=None,
    use_asset_returns=False,
    **kwargs
)
See ReturnsAccessor.up_capture().
value method
Portfolio.value(
    group_by=None,
    in_sim_order=False,
    wrap_kwargs=None,
    engine=None
)
Get portfolio value series per column/group.
By default, will generate portfolio value for each asset based on cash flows and thus independent from other assets, with the initial cash balance and position being that of the entire group. Useful for generating returns and comparing assets within the same group.
When group_by is False and in_sim_order is True, returns value generated in simulation order (see row-major order. This value cannot be used for generating returns as-is. Useful to analyze how value evolved throughout simulation.
value_at_risk method
Portfolio.value_at_risk(
    *,
    group_by=None,
    benchmark_rets=None,
    freq=None,
    year_freq=None,
    use_asset_returns=False,
    **kwargs
)